
The first section discusses just which countries can be counted among that peer group. The second explores three quantitative indicators of social protection and shows the degree to which the United States lags behind. A conclusion argues that a policy of faster and fairer growth could allow the United States to close its social protection gap.
Who are our liberal democratic peers?
My starting point in classifying countries by their degree of liberal democracy, as in earlier work, is the concept of liberal rights practices. In his book, Trust in a Polarized Age, Kevin Vallier defines liberal rights practices as rights that are “recognized in constitutional law, exercised regularly by the people, and embodied in public policy.” That approach makes it possible to treat liberal rights practices not just as values or aspirations, but as observable characteristics of public policy to which it is possible to assign numerical scores.
Vallier lists five liberal rights practices, namely, democratic constitutionalism, markets and private property rights, freedom of association, electoral democracy, and social protection policies. My approach covers a conceptually similar range of practices, but with modifications to terminology and content as needed to better fit the data. Full definitions and data are presented in an online appendix.
- Quality of governance focuses on government institutions rather than policy outcomes. It includes measures of executive constraints, government integrity, rule of law, and government effectiveness.
- Quality of market institutions covers property rights, contract enforcement, investor protections, and quality of regulation.
- Personal freedoms pertain to policies and institutions that guarantee freedom of association, freedom of speech, freedom from discrimination, and agency, a term that Legatum uses to the ability of people to act in accordance with their own desires, based on indicators such as freedom of movement, women’s rights, and due process in criminal law.
- Procedural democracy is democracy in the narrow sense of regular and fair elections with open participation. Procedural democracy is often associated with personal freedoms and quality government, but those outcomes are not part of the definition of democracy in this sense.
- Social protection policies are government policies that ensure that basic needs are met, including cash support and other policies, both on-budget and off-budget, that mitigate extreme inequality and ensure acceptable minimum levels of food, shelter, medical care, and communications.
In what follows, I refer to the first four of these categories as basic liberal rights practices. Each country is assigned a score, LRP*, which is an equally weighted average of the standardized scores for quality of governance, quality of market institutions, personal freedoms, and procedural democracy. Vallier includes the fifth item, social protection policies, in his definition of liberal rights practices, for reasons discussed below. However, this commentary turns his definition into a question: To what extent is it actually true that governments that are liberal democracies in other respects also have strong social protection policies?
The Legatum Institute’s Prosperity Index, together with a few other sources, provide data on basic liberal rights practices for 164 countries. I divide those countries into four groups, as follows:
- Highly liberal democracies. This group consists of 28 countries with LRP* scores that are at least one full standard deviation above the mean for all of the 164 countries.
- Mostly liberal democracies. These 14 countries have LRP* scores greater than a half but less than one full standard deviation above the mean. All highly and mostly liberal countries have positive standardized scores (above the global mean) for all four basic liberal rights practices.
- Partly liberal democracies. These 31 countries have positive standardized scores (above the global mean) for the summary measure LRP* and for procedural democracy. A number of them have negative (below the mean) scores for one or more of quality of governance, quality of market institutions, and personal freedom.
- Not liberal democracies. The remaining 91 countries in the sample are not liberal democracies in that they have either negative LRP* scores or negative procedural democracy scores or both. Only four of these are liberal but not democratic: Hong Kong, Singapore, Malaysia, and Armenia. Another 19 are democratic but not liberal. The remaining 72 countries have negative standardized scores for both LRP* and procedural democracy. With very few exceptions, those illiberal, undemocratic countries have negative scores for all four of the basic liberal rights practices.
Table 1 lists the 42 highly liberal and mostly liberal countries that are the main focus of this commentary, along with their scores for basic liberal rights practices (LRP*).
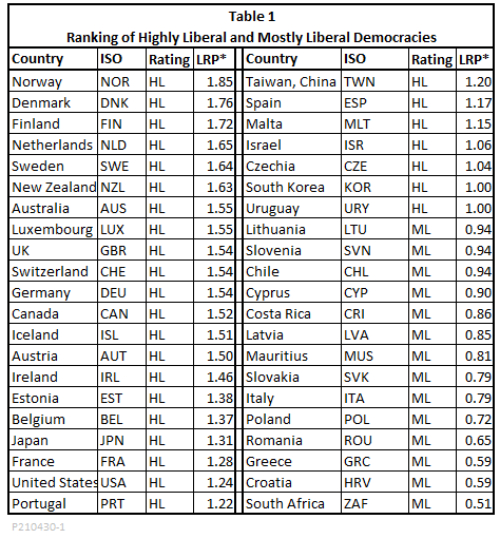
Figure 1 shows a plot of all 164 countries by gross national income (GNI) per capita and standardized LRP* score. The 28 highly liberal countries are shown as dark red dots and the 14 mostly liberal countries are shown in red. The blue dots represent the partly liberal and not liberal countries whose economies are not dominated by oil and gas. The blue trendline is drawn to fit the red and blue groups as a whole. Along that trendline, the LRP* scores are strongly correlated with GNI per capita (R = 0.84). A separate red trendline is drawn for the highly liberal countries alone. The United States falls well below both the red and blue trendline, showing that although it is highly liberal, it is still less liberal than would be expected given its income.
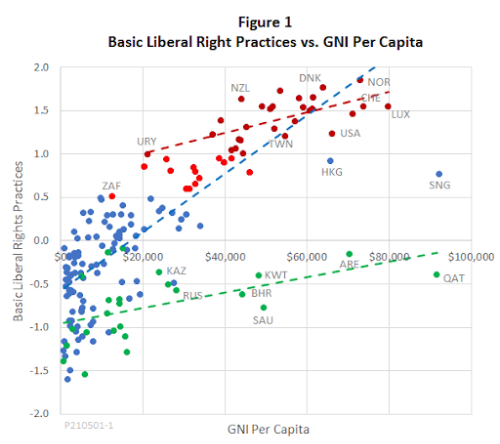
A group of 24 countries whose economies are all heavily dependent on oil and gas, are subject to the so-called “resource curse” or “curse of riches.” They have far lower LRP* scores than would be expected for their levels of income.
Social protection policies of liberal democracies
The social protection policies of the United States and other liberal democracies are the central focus of this commentary. This section explores three approaches to measuring the strength of those policies and determining their relationship to the four basic liberal rights practices.
Social protection spending. Social protection spending is an obvious starting point. The International Labor Organization’s World Social Protection Report provides data on social protection spending for 147 of the 164 countries shown in Figure 1. Figure 2 charts social protection spending as a share of GNI against GNI per capita. Highly liberal democracies are shown in dark red and mostly liberal democracies in bright red. All other countries are shown in blue.
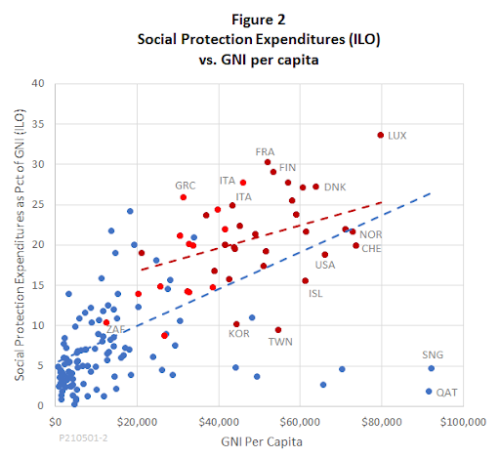
It is clear from the chart that social protection spending and GNI per capita are positively correlated (R = 0.63). The blue trendline is drawn for all countries, and the red trendline for highly liberal democracies alone. It is clear that highly liberal countries, by and large, have social protection spending that is higher than would be predicted from their income alone. The United States, where social protection spending is less than would be expected for a country of its relatively high income, is one of the few mostly or highly liberal democracies that lie below the blue trendline.
The conclusions based on visual inspection of the chart are confirmed by a multiple regression in which social protection spending is the response variable while GNI per capita and LRP* are controls. The multiple correlation between social spending and the two controls is strong and highly significant (R = 0.75, p < 0.0001; lower p indicates a greater level of statistical confidence). The partial correlation of GNI per capita with social protection spending, controlling for LRP*, is R = 0.18 (p = 0.014; the partial correlation of a variable X with Z, controlling for Y, measures the influence of X on Z after accounting for the effect of Y on Z.) The partial correlation of basic liberal rights practices with social protection spending, controlling for GNI, is 0.52 (p < 0.0001). All in all, these results show that both liberal rights practices and income significantly influence social spending, but the influence of LRP* is stronger than that of GNI per capita.
On-budget spending alone, however, does not give a complete picture of social protection policy. One reason is that some countries use off-budget policies to pursue the objectives of social protection. For example, some countries, instead of paying for universal health care from government budgets, require mandatory private health insurance for all but the poorest households. Others use a variety of tax incentives to encourage spending for social purposes such as health care, retirement saving, and charity. Such measures can reduce their reported social protection spending in comparison with countries that emphasize on-budget social protection.
The OECD, whose 36 members include most of the countries classified here as highly liberal, provides a more detailed set of data that includes both on-budget (public) social spending and off-budget (private) social spending that is mandated or encouraged by tax breaks. Figure 3 summarizes the data. With private social spending included, the United States moves from twelfth to second in the OECD ranking. Switzerland and the Netherlands, both of which have mandatory private health insurance, also move up the rankings.
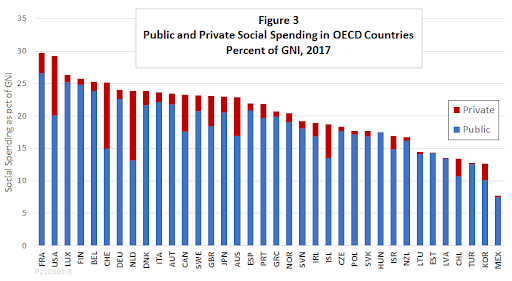
Within the OECD, both public and private social spending have positive and statistically significant correlations with country scores for basic liberal rights practices. The correlation for public social spending is higher than that for private. Not surprisingly, the correlation is higher still for the total of public and private social spending (R = 0.59).
Even so, high social spending, whether public or private, does not guarantee that all disadvantaged persons are actually protected. One reason is that funds may be spent inefficiently. For example, a report from the Commonwealth Fund finds that although U.S. public and private spending on health care is far higher than that of other OECD countries, the United States falls well short of its liberal, high-income peers on several measures of health outcomes.
Another reason why high private social protection spending may not protect the disadvantaged is that the spending itself may be biased toward people who are relatively well-off to begin with. That is clearly the case for the United States. Consider OECD data in the category it calls “tax breaks for social purposes,” which accounts for much of private social spending. For the United States, the largest item in that category is employer-sponsored health insurance. However, low-wage workers are less likely to be covered than high-wage workers, and they receive less generous coverage if they are. Another big line-item in the OECD data, employer contributions to private retirement plans, also disproportionately benefits higher-wage workers. (For data, see Slide 3 in this slideshow from the Tax Policy Center.) The tax deductibility of charitable contributions is a third big line item that the OECD counts toward private social protection spending. In the United States, however, only about 20 percent of “charitable” contributions actually go toward help for the poor. Much of the rest goes to supporting such causes as opera houses, sports programs at elite universities, and noncharitable salaries and other expenses of religious organizations.
In short, data on social spending are just a starting point for international comparisons of social protection policies. For a more complete picture, we turn now to direct measures of income distribution and of the degree to which basic needs are satisfied.
Gini indexes. Gini indexes of income distribution, provide important clues about the effectiveness of social protection policies. A Gini index is a score for the distribution of income (or any other variable) that varies from 0 to 100. The index would be zero in the case of perfect equality and 100 in the case of absolute inequality, that is, if one member of a group had everything and all the others had nothing.
Several sources offer estimates of Gini indexes. However, as Laurence Chandy and Brina Seidel note in a recent study from the Brookings Institution, there are problems with the reliability of Gini data from some of the most widely cited sources, such as the World Bank. One of the most serious problems is that the surveys on which those estimates are based tend to understate the incomes of high earners. Chandy and Seidel offer an alternative set of Gini estimates that correct for the undercounting of high incomes. Their estimates pertain to the distribution of income after accounting for the effects of taxes and transfers.
Figure 4 plots the Chandy-Seidel Gini estimates against our measure of basic liberal rights practices for 122 countries for which both sets of data are available. The dark red dots represent highly liberal democracies, the bright red dots mostly liberal democracies, and the blue dots partly liberal and illiberal countries.
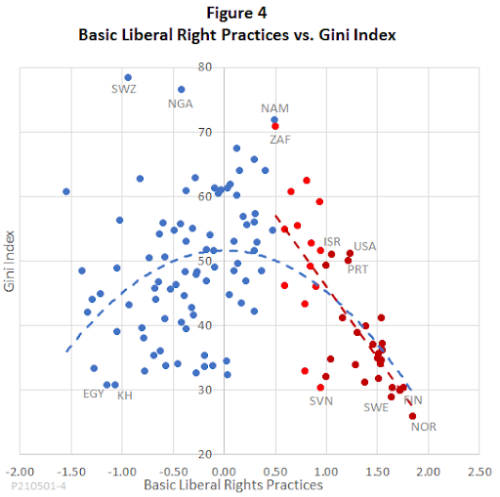
The blue dots are widely scattered, but across all countries, the arched blue quadratic trendline shows a statistically significant tendency for countries with very high or very low liberal rights scores to have somewhat more equal income distributions than those in the middle. Among countries that are not liberal democracies, Eswatini (formerly known as Swaziland), Nigeria, and Namibia have the most unequal income distributions while Egypt and Cambodia are the most equal.
Within the red mostly and highly liberal groups, the relationship between liberal rights practices and income equality is tighter (R = -0.75). More liberal countries tend to exhibit greater equality. Norway, Finland, and Sweden have the lowest Gini indexes within these groups. South Africa (abbreviated ZAF) is by far the most unequal in the bright red, mostly liberal group. Within the dark red highly liberal group, the United States, Israel, and Portugal have the least equal distributions of income. The amount by which a country’s Gini score exceeds what is predicted by its LRP* score – its residual, to use the statistical term – is shown by its distance above or below the trend line. Notably, the United States has the largest residual of any country in its highly liberal peer group.
Basic needs. We turn now to a third way to measure the effects of social protection policies, the degree to which the basic needs of citizens are satisfied in liberal democracies. Abraham Maslow’s five-level hierarchy of needs provides a convenient checklist for organizing human needs. The Legatum Institute’s dataset includes 11 variables that pertain to the two lowest levels of needs in Maslow’s hierarchy, including measures of shelter, nutrition, basic services, health care, longevity, and security from crime. The measures focus on satisfaction of needs at a basic level, rather than the average level of satisfaction; for example, the percentage of the population without adequate shelter rather than the average square feet of living space.
Not surprisingly, the satisfaction of basic needs increases with GNI per capita, but it is also true that more liberal countries tend to better satisfy basic needs than would be expected based on income alone. That is confirmed by multiple regression analysis, which shows that both GNI per capita and LRP* are positively and significantly related to an average of the 11 Legatum basic need scores. However, the United States is an underperformer within its peer group. Among the 28 highly liberal countries, the United States ranks fifth in GNI per capita but 27th in terms of satisfaction of basic needs. The only highly liberal democracy that does less well in satisfying basic needs is Uruguay, the poorest member of the highly liberal group, with a GNI per capita less than a third that of the United States.
Trust, and why social protection policies matter
The data reviewed above are consistent with the hypothesis that countries with high quality of governance, market-friendly economic institutions, strong personal freedoms, and functioning procedural democracies also tend to have stronger social protection policies, as measured by social protection spending, Gini indexes of income equality, and satisfaction of basic needs. For completeness, however, it is worth looking at least briefly at the political theory, as well as the statistics, behind the concept of social protection policies as a liberal rights practices.
To do so, we need to raise the issue of trust. The central theme of Vallier’s book is that social trust, political trust, and liberal democracy are linked in a virtuous cycle. “Since social trust creates good governance and good governance creates political trust,” Vallier writes, “social trust creates political trust by proxy.” To close the circle, he argues that liberal rights practices encourage trustworthy behavior, thereby creating conditions that favor political trust and build general social trust.
This, too, is a hypothesis that can be tested. The Legatum database includes two pertinent indicators of trust. What Vallier calls “social trust” corresponds to the Legatum indicator “generalized interpersonal trust,” which is based on the percentage of people in a given country who answer “Trusted” to the question, “Generally speaking, would you say most people can be trusted, or you can't be too careful. Vallier’s “political trust,” or trust in government, corresponds to a second Legatum indicator based on the percentage of percentage of people responding "Yes" to the survey question, "Do you have confidence in national government?"
To a certain extent, the data uphold Vallier’s contention that liberal rights practices, social trust, and political trust are mutually reinforcing. However, there are some important caveats.
For one thing, the hypothesized relationship among the trust variables and liberal rights practices does not appear to hold for less liberal countries. For countries below the rating of mostly liberal, neither interpersonal trust nor trust in government is significantly correlated with LRP*. As I have discussed elsewhere under the heading of “the trust-in-government paradox,” that finding is due in large part to the fact that a number of countries with very low LRP* scores, such as Uzbekistan and Rwanda, have among the world’s highest trust-in-government scores.
In contrast, among mostly and highly liberal countries, an increase in either of the two trust variables, holding the other constant, is, as Vallier hypothesizes, associated with stronger liberal rights practices. The partial correlation of trust in government and LRP*, controlling for interpersonal trust, is R = 0.64, and the partial correlation of interpersonal trust and LRP*, controlling for trust in government, is R = 0.84, both statistically significant. However, although there is a positive bilateral correlation between the two trust variables (R = 0.56), the partial correlation of interpersonal trust with trust in government, controlling for LRP*, is close to zero (R = 0.05). Perhaps that is what Vallier has in mind when he says that social trust creates political trust “by proxy” rather than directly.
The scatterplot in Figure 5 provides a closer look at just what is going on. As before, bright red dots are the mostly liberal countries and dark red dots the highly liberal ones.
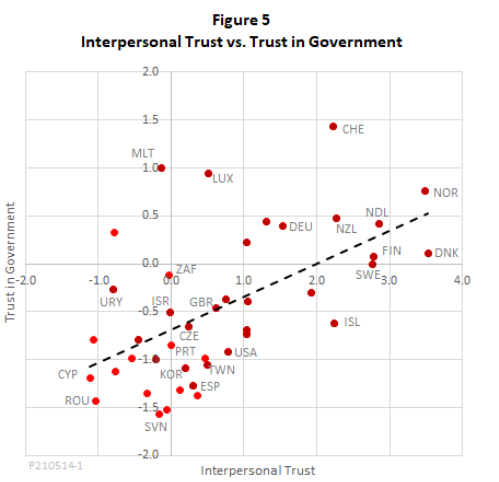
Although the positive slope of the trendline shows that the liberal countries do tend to have higher scores for both trust variables, the fit is not very tight. In reality, the relationship between trust and liberalism involves many other variables and complex channels of causation. For example, casual inspection of Figure 5 suggests that within Europe, there is a gradient toward greater trust and liberalism from south to north. That is confirmed by a significant correlation (R = 0.5) for European countries’ LRP* scores and the latitudes of their capital cities. But it is not just colder winters that make countries liberal. Years of research by Joseph Henrich and colleagues have uncovered a wide variety of historical, cultural, psychological and religious factors that help explain why liberal values and institutions grew deeper roots in the north of Europe than in the south.
Conclusions: How to close the gap
The data reviewed above are consistent with the hypothesis that countries with high quality of governance, market-friendly economic institutions, strong personal freedoms, and functioning procedural democracies also tend to have stronger social protection policies, as measured by social protection spending, Gini indexes of income equality, and satisfaction of basic needs. These findings justify Vallier’s contention that social protection policies should themselves be considered a liberal rights practice along with the four “basic” practices measured by the LRP* indicator.
However, the data also show that the United States systematically underperforms its peers when it comes to effective social protection policies. According to a report on “Global Trends” just released by the U.S. National Intelligence Council, that poses a threat we should not ignore. In the years ahead, the report warns, “relationships between societies and their governments are likely to face persistent tensions because of a growing mismatch between what publics expect and what governments deliver.” The report sees that widening gap as a threat to freedom and democracy and an opening for the spread of illiberal forms of governance.
The response of the previous administration was to try to speed up economic growth with a program of tax cuts and deregulation. However, faster growth alone will not be enough to close the gap, especially if it comes at the expense of social protections. As Brink Lindsey and Samuel Hammond argue in a recent white paper from the Niskanen Center, what we need is Faster Growth and Fairer Growth. It is a false dichotomy, they argue, to say that we must choose either a dynamic market economy or a slow-growth welfare state, weighted down by a bloated bureaucracy. The opposite is true, they maintain. Within the framework of liberal democracy, faster and fairer growth are complementary.
A program of faster and fairer growth would strengthen social protection policies in ways that also remove barriers to growth. For example, such a program would modernize welfare policies to close coverage gaps and strengthen work incentives. It would enhance productivity and improve people’s ability to support themselves by strengthening education, training, and job security. It would bolster families with child allowances and fix health insurance with universal coverage, leading to a healthier workforce. Further impetus to growth could come from supply-side reforms to increase competition, reduce barriers to new housing, shrink a bloated financial sector, and reform immigration to encourage the entry of energetic and talented workers.
Legislation now before Congress, or soon to be submitted, contains many constructive ideas for promoting faster and fairer growth. Let’s pass the good bits, winnow out the bad ones, and build on the result. America should be a leader, not a laggard, within the club of liberal democracies.
Previously posted at NiskanenCenter.org
No comments:
Post a Comment