
By trust, Vallier means two things: Social trust, “that trust which each member of a society has that other members of her society will generally follow publicly recognized moral rules,” and political trust, “that trust which each member of a society has that governmental institutions will follow fair procedures and produce positive results.” (p. 6) He sees the two as joined in a virtuous circle through the intermediary of good government: “Since social trust creates good governance and good governance creates political trust, social trust creates political trust by proxy.” And to close the circle, he maintains that institutions of good government, by enforcing trustworthy behavior, create conditions that favor political trust and build general social trust. (p. 214)
By good governance, Vallier means liberal governance – in the sense of classical liberalism, not the American usage that makes liberalism a synonym for the political left. Yet, Vallier does not defend liberalism as an ideology. He focuses more pragmatically on five key liberal rights practices: freedom of association, markets and private property rights, social welfare programs, democratic constitutionalism, and electoral democracy. (p 277) His message is that if we embed these liberal rights practices in our institutions, trust will follow, polarization will recede, and a world in which politics is not war will become possible.
As someone engaged in empirical research on the quality of government, I found this all intensely interesting. Although Vallier’s book is primarily a work of political philosophy, I could hardly wait to fire up my spreadsheets to investigate the many hypotheses he suggests. Do trust, quality of government, and liberal rights practices really matter? Do they matter everywhere, or only in countries that are already liberal? The answer is that trust and good governance do matter, but the story is not always a simple one. Some of the patterns are quite complex, so the results reported in this commentary should be considered preliminary.
The data
To test hypotheses, we need data. The principal data set I have used in my previous research comes from the Legatum Institute, a London-based think tank whose mission is “to create the pathways from poverty to prosperity, by fostering open economies, inclusive societies and empowered people.” The data include 294” indicators,” organized into 65 “elements,” nesting in 12 “pillars” and three “domains.” The data cover 168 countries, of which I was able to use 165, dropping Cuba, Somalia, and Syria due to the unavailability of supplementary data from other sources. Here are brief descriptions of the main variables used in what follows.[1] (For details, see Legatum’s methodology report.)
Trust. The Legatum database includes seven indicators pertaining to trust. Six of them are institutional – trust in government, the judiciary, local police, politicians, financial institutions, and the military, plus a measure of generalized interpersonal trust. In this commentary, I will use only the first and the last of these indicators.
Trust in government is represented by the percentage of people responding "Yes" to a Gallup World Survey question, "Do you have confidence in national government?" I will treat this variable as corresponding to what Vallier calls “political trust.” Generalized interpersonal trust is the percentage of people responding "Most people can be trusted" to the question "Generally speaking, would you say most people can be trusted, or you can't be too careful?” Legatum pieces together data from several survey sources to get this indicator. I treat it as a measure of what Vallier calls “social trust.” Undoubtedly, the other four trust indicators raise many points of interest, but space precludes examining them in detail here.
Quality of government. As I use the term, quality of government is a somewhat narrower concept than “good governance,” as Vallier uses the term. The intent of the narrow approach is to focus on the impartiality, integrity, and technocratic competence of the government institutions. It is not meant to measure the moral worth of government actions or the desirability of policy outcomes. The summary measure of quality of government is an average of eight elements from the Legatum database: rule of law, government integrity, protection of property rights, contract enforcement, protection of investor rights, executive constraints, government effectiveness, and regulatory quality.[2]
Procedural democracy. The strength of a country’s procedural democracy is measured by an average of seven indicators pertaining to the electoral process and participation provided by Freedom House. These seven indicators are a subset of the full range of data on political procedures, human rights and civil liberties that Freedom House uses to rate countries as “Free,” “Partly Free,” of “Not Free.”
Personal freedom. The measure of personal freedom used here is built up from Legatum elements that pertain to freedom of assembly and association, freedom of speech and information, absence of legal discrimination, and something that Legatum calls “agency.” The “agency” element, in turn, is built up from indicators of freedom of movement, forced labor, women’s rights, criminal justice, and related items.
The personal freedom and democracy scores used here not only measure different things; they measure different kinds of things. The democracy variable pertains to government institutions, namely, the degree to which they conform to liberal democratic procedures. The personal freedom score pertains to the outcomes, namely, the degree to which countries with high-quality, democratic institutions allow citizens to live their lives as they wish, without subjection to arbitrary authority.
Despite that conceptual difference, freedom and democracy are highly correlated for the sample of 165 countries that we are looking at. Cross-country differences in democracy account for about 85 percent of the variance in personal freedom.[3]
Basic needs. The degree of satisfaction of basic needs is measured by an average of several elements from the Legatum database, including measures health care systems, preventive interventions, physical health, longevity, basic services, connectedness, material resources, nutrition, protection from harm, shelter, and protection from crime. This measure of need satisfaction has somewhat of an egalitarian bias. Many of the underlying indicators focus on the share of a population who achieve minimal standards, rather than averages for the whole population, for example, the share of households that have running water. Satisfaction of basic needs is positively, but not perfectly correlated with GDP per capita.
Liberal rights practices. The Legatum data do not provide a direct measure of what Vallier calls liberal rights practices. Still, several of the variables listed above include components that relate directly or indirectly to those practices.
- Quality of government includes several elements that represent practices essential for the protection of property rights and the operation of markets, including rule of law, contract enforcement, protection of property rights, protection of investor rights, and regulatory quality.
- Procedural democracy pertains to the electoral selection of government officials and rights to participate in elections.
- Personal freedom focuses on freedom of speech, freedom of assembly, and agency.
In some of the following sections, use the three main components as separate variables. In other sections, I break those components down further into the constituent variables. In still other places, it is convenient to have a single, summary variable to represent the overall strength of a country’s liberal rights practices.[4]
Country Groups. At several points, I will break the full sample of 165 countries down into country groups according to the strength of their liberal rights practices. The first group, which I refer to as “highly liberal,” comprises thirty-three countries that fall in the top quartile for their quality of government freedom, and democracy. A second group, which I call “liberal,” comprises 51 countries–the 33 highly liberal countries plus 18 others–that have above-average scores for overall liberal rights practices and for each of its three main components, quality of government, democracy, and personal freedom. I will refer to the remaining 113 countries as “nonliberal.”
A list of all 164 countries by group with values of key variables for all of them can be found in Table 1 of the Online Supplement.
An overview, and some picture puzzles
The obvious place to begin was to run some summary regressions to see if trust in government and interpersonal trust are indeed associated with each other and with liberal rights practices, as Vallier suggests. They are, but not as strongly as one might think, and more strikingly, they do not always even have the expected signs.
Consider a regression that uses the overall measure of liberal rights practices as the response variable and the two trust variables as the controls for the full sample of 164 countries. The trust variables jointly account for just over a quarter of the cross-country variations in liberal rights practices. However, while interpersonal trust is directly related to liberal rights practices, as expected, trust in government is related inversely. There is a clear tendency for trust in government to be higher in governments that have lower scores for liberal rights practices–finding we will return to shortly. Regressions using each of the main components of liberal rights practices (quality of government, democracy, and personal freedom) separately as response variables yield similar findings. (For readers interested in details, full statistical results, can be found in an Online Supplement . The results in this paragraph are in Sheet S1 of the supplement.)
Vallier’s model of trust and governance allows for bidirectional causality. As he puts it, “democratic constitutionalism helps to create real social and political trust, and creates conditions whereby social and political trust manifest various positive feedback loops” (p. 215). Such bidirectional causality, suggests that the regressions could instead be posed in reverse, with the two kinds of trust as the response variables and liberal rights practice as the controls. In multiple regressions with the trust variables as controls, the three liberal rights variables jointly account for about a third of the cross-country variance in interpersonal trust, with quality of government and personal freedom contributing positively to but democracy contributing negatively. When the response variable is trust in government, the liberal rights variables jointly account for about a quarter of the variance. The quality of government contributes positively and both personal freedom and democracy contribute negatively. (Online Supplement, S1.)
In sum, although these preliminary results support the general hypothesis that “trust matters,” not all the pieces seem to fit together neatly. It does not seem to be the case that each kind of trust reinforces the other, nor is not true in every case that liberal rights practices both reinforce and are reinforced by trust. Furthermore, the preliminary results may be subject to various kinds of statistical bias and do not include other variables that may affect the relationships in question.
We need to dig into the data more deeply. Some scatter plots will help to spotlight areas for further investigation. Figures 1 and 2 compare countries’ scores for liberal rights practices compared to their scores for trust. Figure 1 places trust in government on the vertical axis and liberal rights practices on the horizontal. Figure 2 is otherwise the same but puts interpersonal trust on the vertical axis. In both figures, all of the variables are standardized, so that zero represents the mean for that variable and the units on the axes indicate the number of standard deviations above or below the mean.[5] The charts are color coded. Green points represent the 33 “highly liberal” countries. Red and green points together represent the 51 “liberal” countries, and blue points represent the 113 “nonliberal” countries.[16] Selected points are labeled to help give a general idea of where various kinds of countries fit in. The data needed to identify any non labelled point or locate any country not already flagged can be found in Table 1 of the Online Supplement.
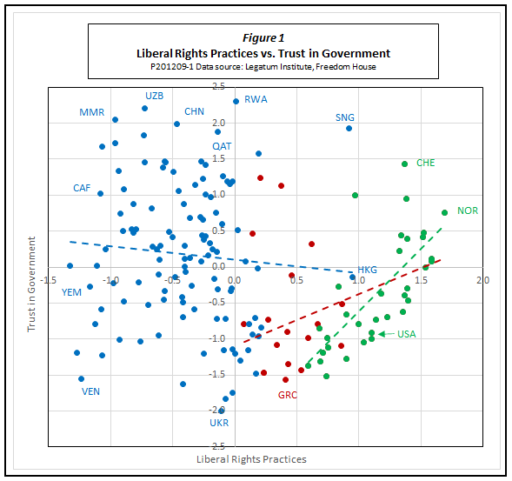
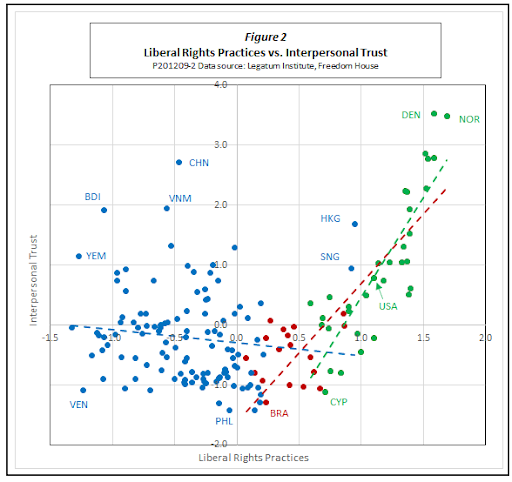
The two charts have some strong similarities. In both charts, the 33 highly liberal countries (green) are clustered tightly around their respective trendlines. In both cases the trendlines are positively sloped, indicating that stronger liberal rights practices are associated with greater trust. The same holds true for the 51 liberal countries, although the fit around the red trendlines, which are based on all 51 countries in the green and red groups, is not quite as tight. Multiple regression analysis shows that trust in government and interpersonal trust jointly accounts for an impressive 70 percent of the variance in liberal rights practices for the liberal group and 80 percent of the variance for the highly liberal group. (Online Supplement S2.) In short, the relationships between trust and governance for these countries look very much like one would expect from reading Vallier’s book.
The 113 nonliberal countries represented by the blue dots are another matter. They are scattered over a wide range of values for both trust in government and interpersonal trust. The blue trendlines in Figures 1 and 2 show slight negative slopes, but the correlations are statistically insignificant in both charts. The significant inverse correlation between trust in government and liberal rights practices for the full 164-country sample that was found in the preliminary regressions discussed above turns out to arise entirely from the fact that a majority of the liberal and highly-liberal countries have below-average trust scores. That is clearly visible because the red and green dots cluster predominantly in the lower-right quadrant of Figure 1. In contrast, the green dots (but not the red) cluster more strongly in the upper-right quadrant of Figure 2, accounting for the positive relationship between interpersonal trust and liberal rights practices for the full 164-country sample found in the preliminary regressions.
Interpersonal Trust vs. Trust in Government
Figures 1 and 2 reveal a lot, but before proceeding, we need to look at one important relationship that they do not show clearly, namely, that between the two types of trust. Vallier confidently posits that “Since social trust creates good governance and good governance creates political trust, social trust creates political trust by proxy.” If so, we would expect our measures of interpersonal trust and trust in governance to be strongly correlated with each other. However, as Figure 3 shows, that is not consistently the case.
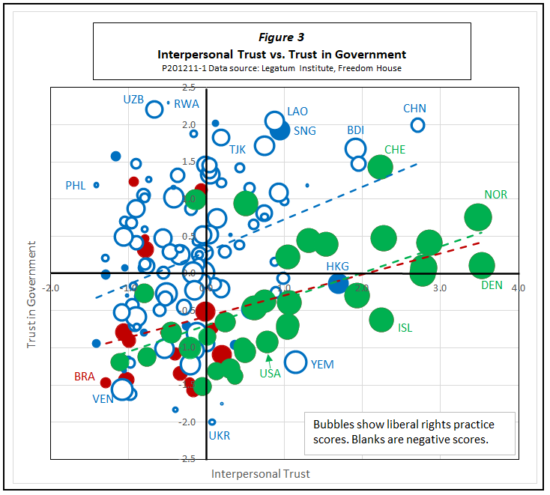
This figure plots standardized scores for interpersonal trust on the horizontal axis and trust in government on the vertical axis. The size of the bubbles for each country is proportional to their score for overall liberal rights practices. Solid bubbles show positive (above average) standardized scores for liberal rights practices, and empty bubbles show negative (below-average) scores.
For the entire sample, differences in interpersonal trust account for just 5 percent of the variance in trust in government. For nearly half of all countries, the standardized values for interpersonal trust and trust in government do not even have the same sign. The relationships are slightly stronger within the groups,as shown by the positively sloped trendlines in Figure 3, but are far from impressive. For the green, highly liberal group, interpersonal trust accounts for about a third of the variance in trust in government.; for the liberal group (red plus green), less than a fifth; and for the blue, nonliberal group, only a tenth. (Online supplement S3)
Furthermore, as we have seen, the relationship between the trust variables and liberal rights practices are far from consistent. For the sample as a whole, liberal rights practices are related directly to interpersonal trust but inversely to trust in government. When we look at pairs of countries that fall close to one another in the chart, the result is some strange bedfellows.For example, the United States, a prosperous, highly liberal country, has positive interpersonal trust and negative trust in government scores that do not differ much from impoverished, highly illiberal Yemen. Brazil and Venezuela, which share a geographical border but are far apart in terms of liberalism and prosperity, have nearly identical negative scores for both types of trust. With its top-notch ratings for liberalism and prosperity, Switzerland is roughly matched for its high levels of both kinds of trust by poor, authoritarian Burundi.
The trust-in-government paradox
At this point, practical considerations force a decision. Together, the three charts offer a wealth of intriguing features for further investigation, but time and space dictate that this commentary has a finite length. With that in mind, I will reluctantly set aside detailed examination of what is going on within the liberal group of countries for another day, and focus instead on what is the most surprising of our preliminary findings: The fact that so many of even the most illiberal countries in the blue group have above-average, and sometimes far-above-average trust in government. I will refer to this tendency for the citizens of so many impoverished, badly-run countries to place so much trust in their governments as the trust-in-government paradox.[7]
Some “obvious” ideas regarding factors that might gain high trust for low-quality governments turn out to not stand up. A good first guess would be that some nonliberal governments might gain public trust by meeting basic needs for shelter, nutrition, and so on better than others that are equally nonliberal. However, there turns out to be no statistically significant bivariate correlation between trust in government and need satisfaction for the nonliberal countries. Similarly, there are no significant bivariate correlations of trust in government with measures of war, terrorism, overall security, or GDP per capita. And perhaps surprisingly, there is no significant bivariate correlation between trust in government and the equality of income distribution, as measured by a Gini index, for either nonliberal or highly liberal countries. (Greater equality is positively associated with greater interpersonal trust in both liberal and nonliberal countries, however.)
We also find no significant bivariate correlation within the nonliberal group between trust in government and our overall measure of liberal rights practices. However, that finding deserves a closer look. A multiple regression with trust in government as the response variable and liberal rights practices broken down into three separate controls measuring the quality of government, personal freedom, and democracy gives a clearer picture. Those three controls jointly account for a quarter of the cross-country variance in trust in government. The increase in explanatory power is explained by the fact that quality of government, other things being equal, is associated with higher trust in government. In contrast,personal freedom is associated with lower trust. The democracy variable has no statistically significant effect. (Online Supplement S4.)
Looking more deeply still, we find that just two of the elements within the quality of government component account for all of its explanatory power for the nonliberal countries. (In contrast, all eight elements of quality of government are positively correlated with trust in government for the highly liberal group of countries.) One of the significant elements is rule of law, a measure of whether laws, regardless of their nature, are applied evenhandedly to all. The implication is that even handed application even of inherently illiberal laws and regulations (for example, restrictions on freedom of religion or travel) produces less distrust of government than arbitrary enforcement of laws that might, on their face, seem more liberal.
The other significant variable in the quality group is quality of regulation. At first, I was surprised to see that, since “quality of regulation,” in the U.S. context, calls to mind esoteric matters like whether the EPA uses the best available science in regulating the lead content of drinking water. However, a closer look at the underlying data makes me think that in the context of less developed countries, “quality of regulation” has a much less technocratic meaning and instead, mostly means freedom from red tape–things like how hard it is to get a building permit or whether a food stand is likely to be hassled by health inspectors demanding petty bribes.
Within the personal freedom group, all four elements –official discrimination, agency, freedom of assembly, and freedom of speech– have significant negative bilateral correlations with trust in government. Of these, the freedom of speech and assembly variables are slightly more influential. (In contrast, within the highly liberal group, all four elements are positively associated with trust in government.)
Even broken down this way, variables from the liberal rights practice group explain at most 30 percent of the variance of trust in government. However, an inspection of bilateral correlations for additional variables reveals some other factors that also matter:
- A broad measure of education has only a weak correlation with trust in government, but the broad measure conceals conflicting tendencies. Among nonliberal countries, digital literacy tends to improve trust in government, while average years of adult education reduces trust. (In the highly liberal group, all education-related indicators tend to increase both trust in government and interpersonal trust, with an especially large effect for digital literacy.)
- Individual elements in the basic needs category have small and mostly negative effects on trust in government for countries in the nonliberal group. However, protection from property crime, and even more, protection from violent crime, are exceptions, having moderately strong, positive effects on trust in government. (Among highly liberal countries, satisfaction of all kinds of basic needs is strongly correlated with both kinds of trust.)
- The growth rate, but not the level, of GDP per capita, has a marginally favorable effect on trust in government among nonliberal countries. (Among highly liberal countries, it is just the reverse: the level, but not the growth rate, of GDP is positively correlated with trust in government.)
- Interpersonal trust has a small but significant positive bilateral correlation with trust in government, but the effect disappears completely in multiple regressions.
These suggestive bilateral correlations can be further tested by running a multiple regression that uses trust in government as the response variable, and for controls, uses regulatory quality, rule of law, freedom of assembly, freedom of speech, digital literacy, years of adult education, protection from property crime, protection from violent crime, and growth rate of GDP. Those nine control variables jointly account for more than half of the variance in trust in government, roughly twice as much as can be accounted for by liberal rights practices alone. The biggest surprise in the regression results (at least to me) is that years of adult education have the strongest effect on government trust of any of the variables–and that the effect is negative. (Online Supplement S4).
What accounts for the other half of the variance, that is, for the remainder of the trust-in-government paradox? Some of the explanations may simply lie in bad data. If the data are corrupted by measurement error, all observed correlations will decrease, even if the underlying causal relationships are valid.
In part, measurement error likely reflects the difficulties of gathering information in some countries, whether they are data like GDP, which come from official sources, or privately collected survey data. Places where there is active civil conflict or the central government does not control its entire territory are especially problematic. We get a hint of such an effect if we drop 13 such countries from the sample.[8] Doing so increases the share of the variance of trust in government that is explained by the nine-control multiple regression by about four percentage points.
In the case of survey data, another possible source of measurement error may be the reluctance of people in authoritarian countries to provide truthful answers to researchers, especially when the question is, “Do you have confidence in your central government.” The significant negative correlation between freedom of speech and expressed trust in government within the nonliberal group of countries suggests such an effect.[9]
Finally, it is fair to presume that country-specific effects play a role in generating trust in government in many of the nonliberal countries in our sample. Rwanda’s citizens may trust their government, whatever its faults, simply because it has prevented return of the genocide of the 1990s. Citizens of China may trust the government because of the country’s remarkable growth record. Russians may trust their government, at least in part, because of its proficiency in the arts of propaganda.
What have we learned? What questions remain?
This study has by no means squeezed every drop of information from the available data. Even so, we have learned much of interest about trust and quality of government. Among our findings:
1. Within the groups of liberal and highly liberal countries, especially the 33 highly liberal ones, the main relationships hypothesized by Vallier appear to hold true, at least on first inspection: Trust creates conditions in which liberal rights practices can flourish and those practices, in turn, reinforce both interpersonal trust and trust in government.
2. The picture is much more mixed among the 113 nonliberal countries. Even within this group, interpersonal trust correlates positively with liberal rights practices, but trust in government correlates inversely. Breaking liberal rights practices down into components, quality of government correlates positively with trust in government, but democracy and personal freedom correlate negatively with trust in government. In fact, of all countries, trust in government is strongest in some of the least liberal–something I have called the “trust in government paradox.”
3. Among the factors that contribute to high trust in government among nonliberal countries are strong rule of law, high quality of regulation, lower scores for freedom and democracy, strong protection from crime, higher economic growth rates, higher levels of digital literacy, and lower average years of adult education. Those factors jointly account for a little over half of the cross-country variance in levels of trust in government among the nonliberal countries.
4. Most countries characterized by the combination of high trust in government and low levels of liberal rights practices offer only low to moderate satisfaction of basic needs. Countries with high standards of living and high quality of government combined with low scores for freedom and democracy and high trust in government are quite rare. Singapore and Hong Kong are the only convincing examples. Mainland China might be seen as an aspiring but still distant candidate. The least illiberal oil states, such as the UAE and Qatar, also share some characteristics of this group.
However, those findings leave many important questions unanswered, especially with regard to the highly liberal countries, which deserve more attention than they have received in this commentary. After all, Vallier’s book, which inspired this whole data-mining project, is primarily concerned with whether today’s highly liberal countries can maintain the high standards of government they have achieved rather than why poor, badly governed countries are the way they are.
Among the issues worth exploring is the relationship between trust in government and interpersonal trust in highly liberal countries. For example, why is it that among the 33 highly liberal countries, 21 have trust-in-government scores below the average for the full 164-country sample, whereas only 7 have below-average interpersonal trust. Does that mean that distrust of government is actually a healthy thing in liberal democracies, at least up to a point? How do education, the satisfaction of basic needs, and other types of trust and social capital affect the strength of liberal institutions? What is the importance of having a strong social safety net, something that Vallier considers a key liberal rights practice, but which this commentary has almost entirely ignored?
Finally, it would be interesting to know if the dots in our charts are scattered at random, or whether they are pulled toward a limited number of stable equilibria? Does the highly liberal group itself represent an equilibrium, in the sense that temporary shocks trigger restorative mechanisms, or is liberal democracy inherently fragile? Is the prosperous, well-governed, but illiberal Singapore model an alternative equilibrium toward which other rich countries could aspire, or is it the product of an inimitable set of circumstances? Are the high-trust and low-trust configurations among poor, nonliberal countries distinct equilibria, or just the endpoints of a continuum?
There is plenty of material here for further exploration.
[1] I have used five-year averages for most of the variables. In doing so, I was motivated partly by problems in the underlying data, such as random measurement error and use of older values when new observations are missing. Also, many of the response variables examined here seem likely to respond only slowly to changes in relevant control variables. In a majority of cases, correlations among variables are stronger when five-year averages are used rather than observations for the most recent year.
[2]In a previous study, I included Legatum’s political accountability element, a measure of procedural democracy, as a component of quality of government. Here I treat procedural democracy separately. Readers of that study will recognize the quality of government used here as the variable “QoG8” in that previous work.
[3]In saying “X accounts for such-and-such a percentage of the variance in Y,” I refer to the statistic “R2,” the square of the correlation coefficient for the two variables. An R2 of 1 means that the value of X is perfectly proportional to the value of Y. An R2 of 0 means the two variables are entirely unrelated. For example, if the two variables for height and weight of a group of students have a correlation coefficient R of 0.9 and an R2 of 0.81, that means that 81 percent of the variation in the students’ weights is statistically associated with differences in their heights. Correlation does not necessarily imply causation.
[4]The overall measure of liberal rights practices, developed using a principal components approach, is a weighted average of the underlying indicators of quality of government, freedom, and democracy. It captures about 75 percent of the variance in the full set of underlying indicators.
[5]As help in interpreting the normalized scores, keep in mind that when a variable is normally distributed, about 68 percent of observations fall within 1 standard deviation of the mean and 95 percent within two standard deviations.
[6] The seventeen countries represented by blue dots that lie to the right of the vertical axis have higher than average overall scores for liberal rights practices but do not count among the 51-liberal countries because they score below average on at least one of the three liberal rights components. For example, Singapore has very high quality of government, but negative standardized scores for both democracy and personal freedom.
[7]For purposes of this section, the sample is reduced from 164 to 152 countries due to missing Gini data for some countries. All 51 liberal and highly liberal countries are included along with 101 illiberals.
[8]The 13 countries are Mali, Ukraine, Colombia, Pakistan, Yemen, Nigeria, Myanmar, Democratic Republic of Congo, Sudan, Iraq, Central African Republic, and South Sudan.
[9]Additionally, technical issues may also affect the strength of measured statistical relationships among variables. For example, this study has not thoroughly explored possible nonlinear structural relationships among variables, or corrected for the fact that not all variables are normally distributed. Furthermore, the use of five-year averages for most variables, while useful in revealing long-term relationships, may conceal noteworthy transient relationships between trust and other variables caused by business cycles, natural disasters, or short-lived violent conflicts.
No comments:
Post a Comment