
In a recent three-part essay, the Niskanen Center’s Brink Lindsey acknowledges all that the modern market system has done to incentivize innovation and coordinate the production and distribution of goods and services. He is concerned, though, that the economists who have assumed leadership of the free-market intellectual movement sometimes take the existence of markets themselves for granted. He adds a vital qualification:
A well-functioning market system is neither self-executing nor self-sustaining. To achieve what they are capable of, markets need to be embedded in and supplemented by supportive legal, political, and social institutions.
The idea that institutions are important to the proper functioning of a market economy is hardly new. Harold Demsetz’s work on property rights and Douglass North’s writings on institutions and transaction costs are well-known landmarks in the literature. The question of quality of government (QoG) is a somewhat narrower, but still broad question within the study of economic institutions. Bo Rothstein’s 2011 book on QoG provides an excellent overview of the literature and many original contributions.
The scope of this commentary is much less ambitious than any of these classic works. As a “statistical portrait,” it is more descriptive and exploratory than a rigorous exercise in hypothesis testing. Still, by highlighting some key relationships, I hope to point the way to potentially fruitful topics for further research. And even with these disclaimers, the findings reported here shed light on important questions regarding the relationship of QoG to democracy, personal freedom, and the satisfaction of basic human needs.
What is quality of government?
The first task is to develop a summary measure of the quality of the supportive legal, political, and social institutions that form the essential foundation for a well-functioning market economy. As the primary source, I will draw on a set of data issued annually by the Legatum Institute, a London-based think tank whose mission is “to create the pathways from poverty to prosperity, by fostering open economies, inclusive societies and empowered people.” The downloadable data in the institute’s latest annual prosperity report is substantially expanded and reorganized. It now includes 294 indicators, organized into 65 “elements,” nesting in 12 “pillars” and three “domains.” Of these indicators, 206 are new for 2019, with 88 carried forward from previous years. Full description of the organization and sources of the indicators can be found in a detailed methodology report.
The Legatum data include a dozen or more elements that appear plausibly to bear on quality of government. From these I selected the following nine:
- Rule of law
- Government integrity
- Protection of property rights
- Contract enforcement
- Protection of investor rights
- Executive constraints
- Government effectiveness
- Regulatory quality
- Government accountability
The selection reflects a pragmatic, procedural perspective on quality of government. The first six items are consistent with Rothstein’s view that impartiality is the key marker of QoG. By impartiality, he means that “when implementing laws and policies, government officials shall not take into consideration anything about the citizen/case that is not stipulated beforehand in the policy or the law.” Items seven and eight on the list tilt more toward technocratic competence in operating the machinery of government than on impartiality. The ninth item, government accountability, will be discussed separately in the next section.
This pragmatic approach is much narrower than that adopted by Marcus Agnafors and other writers who argue for including ethics and morality in QoG. Agnafors points out that a purely procedural concept of QoG could give a high rating to, say, a government that wrote clear laws for ethnic cleansing of its territory, enforcing them impartially and offering formal due process to those marked for forced resettlement. For present purposes, however, it would be inappropriate to conflate quality government and morally good government in this way. By adopting a pragmatic, procedural view of QoG, we can ask whether higher QoG is associated with better outcomes in terms of human rights, freedom, and satisfaction of basic needs – questions that would make no sense if our measure of QoG itself encompassed those outcomes. (Spoiler alert: governments that produce excellent outcomes based on low QoG turn out to be rare.)
Our definition of QoG also overlaps with what Noel D. Johnson and Mark Koyama call state capacity, by which they mean “an ability of a state to collect taxes, enforce law and order, and provide public goods.” In practice, procedural QoG would appear to be a necessary condition for high state capacity, but as I understand it, the latter concept encompasses substantively good policies and good outcomes as well as competence and impartiality.
In addition to the qualitative considerations discussed above, the selection of the nine indicators to be included in QoG was also guided, in part, by exploratory factor analysis. The nine QoG elements load strongly on a single factor, so their average can be reliably used as a single variable, which I will call QoG9. Exploratory analysis indicated that it makes no significant difference whether GoG9 is computed as a simple average of the nine elements or as a factor-weighted average, so I use the simple average in all of the tests discussed below. Full data underlying QoG9 and other variables, full data for the figures, and as full details of selected factor analysis and regression tests can be found in an online appendix.
Quality of government and democracy
Many people who live in democratic countries tend to think of “good government” and “democracy” as synonymous. However, as Rothstein explains, the relationship between the two is complex. On the one hand, if a country is to be considered more than superficially democratic, procedural rules for the selection of leaders must be embodied in a system of law and elections and must be carried out impartially. In that sense, democracy implies at least some minimal level of QoG. On the other hand, it is evident, when we look around the world, that there are countries where voters in honest elections enthusiastically elect and re-elect leaders who are known to be corrupt or partial to their own class, clan, or ethnic group. On the other hand, one can point at least to isolated examples of countries that have reasonable QoG scores, as defined here, yet score poorly on measures of procedural democracy.
Of the nine Legatum elements in QoG9, the ninth, “government accountability,” is explicitly a measure of procedural democracy. It is based, in turn, on four underlying indicators: (1) A measure of the degree to which there is a shared consensus on democracy and a market economy as a goal; (2) an indicator from Freedom House of political participation and rights; (3) a measure of the level of democracy from the Center for Systematic Peace; and (4) a measure of the adequacy of complaint mechanisms from the World Justice Project.
In a factor analysis, “government accountability” makes the cut for inclusion in QoG9, but only barely. Its correlations with the other eight QoG elements, while all statistically significant, are the smallest of any in the complete cross-correlation table. Government accountability is significantly correlated with the average of the other eight elements (a variable I will refer to as QoG8), but the R2 is a modest 0.49.
These statistically significant but not overwhelmingly strong correlations suggest that although there is a general tendency for high-quality governments to be democratic, there are exceptions. To further investigate the relationship of procedural democracy to government quality, I turned to a more detailed set of democracy data from Freedom House, including three indicators of the freedom and fairness of the electoral process and four indicators of freedom of political participation. I combined these into a measure of procedural democracy. The correlation of this broader measure of procedural democracy with QoG8 (excluding government accountability) is 0.62 (R2 = 0.39) for the sample of 162 countries for which both variables are available.
Figure 1 shows a scatter plot of QoG8 vs. procedural democracy as based on the seven components from Freedom House. Scores are normalized so that the axes show standard deviations above or below the mean for each variable. The dotted trendline shows that there is a tendency for countries that are more democratic to have relatively high QoG ratings. Countries above the trendline have higher QoG than would be expected based on their level of democracy alone, while the opposite is true for those below the trendline.
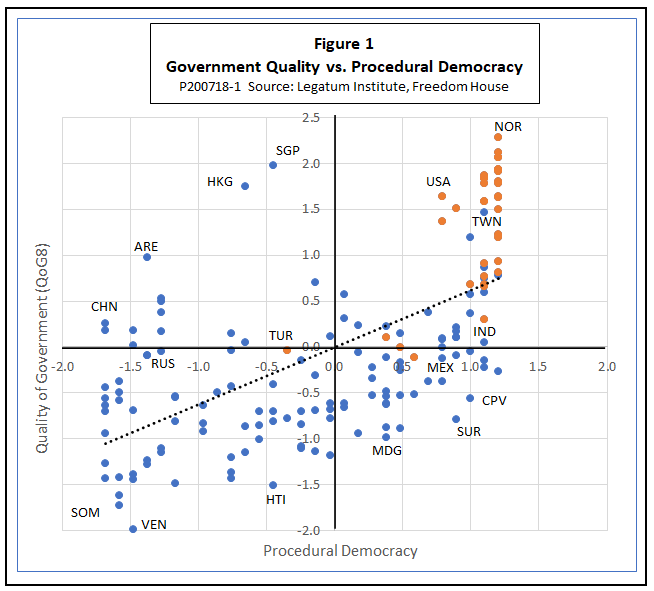
The diagram is divided into quadrants, with notable outliers labeled by their ISO codes. Starting with the northeast quadrant, we find countries that have better-than-average ratings on both procedural democracy and government quality, with Norway winning the blue ribbon. Most OECD countries (orange dots) and most EU members belong in this quadrant. Taiwan is the best-rated among countries outside the OECD. A few countries, such as India, have higher-than-average QoG scores, but fall below the trendline, indicating that they do not rate as highly as we would expect, given their level of democracy.
The northwest quadrant contains countries with higher-than-average QoG but lower-than-average democracy scores. Singapore and Hong Kong are conspicuous outliers, although one suspects that Hong Kong has slipped in both categories since these data were collected. Lower and farther to the left we find countries like the United Arab Emirates and China, which are less well governed, but still have higher-than-average QoG scores and are even less democratic.
Part of the southwest quadrant lies above the trendline. Russia is found there, showing that although its quality of government is below average, it is nonetheless a bit better than we would expect from a country so undemocratic. The same goes for Turkey, which is the least democratic country in the OECD. The part of the southwest quadrant that falls below the trend line includes some of the world’s basket cases – Somalia, Venezuela, and Haiti, among others.
Finally, the southeast quadrant includes countries that are more democratic than average but less well governed. Mexico is the only OECD country in this quadrant, with a QoG just below the average. The extreme outliers in this region are mostly very small countries, such as Cape Verde, Suriname, and Madagascar. Two large countries, the Philippines and Ukraine, also fall into this quadrant, but closer to the center of the grid.
Government quality, GDP, and oil
Next, we turn our attention to the relationship between QoG and GDP per capita (measured in constant U.S. dollars at purchasing power parity, IMF data). There is a strong tendency for countries with higher GDP to have better governments. For the 162 countries in our sample, the correlation of government quality with GDP per capita is 0.80. (The relationship is by-and-large logarithmic; all statistical results reported use log GDP.)
Figure 2 shows a scatter plot of government quality against GDP. The vertical axis this time shows raw QoG9 scores on a scale from 0 to 100. It quickly becomes apparent that the countries shown fall into two distinct groups. To emphasize that pattern, the figure highlights 20 countries that are often referred to as petro-states as orange dots. These comprise all countries that have oil and gas revenues equal to 5 percent or more of GDP, plus Bahrain. (Bahrain has many traits in common with other Middle East petro-states but does not make the 5 percent cutoff, since much of its petroleum industry is based on refining crude oil originally extracted in neighboring Saudi Arabia.) Petro-states outside the Middle East include Russia, Kazakhstan, Equatorial Guinea, Angola, and Ecuador. Norway, the United States, and Canada, although all large oil producers, do not make the 5-percent cutoff.
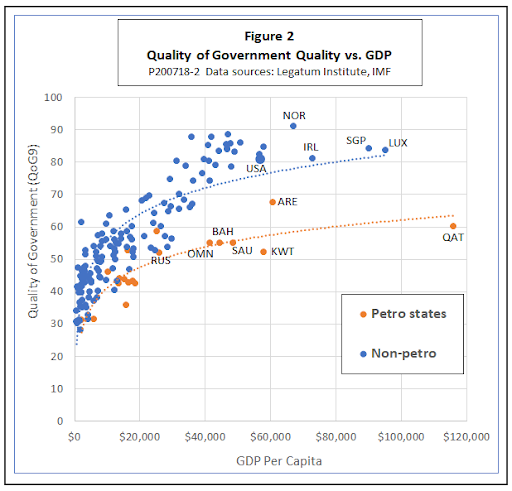
QoG is positively related to GDP in both the petro and non-petro groups, but the trend line for the petro-states lies well below that for the non-petros. Within the petro group, the correlation of QoG with log GDP is 0.85 and within the non-petro group it is 0.87. A multiple regression of QoG on log GDP and a dummy variable for membership in the petro group shows a multiple correlation of 0.87, with statistically significant regression coefficients for both independent variables (p < 0.001).
The relatively poor quality of government in the petro-states illustrates what is widely called the resource curse or curse of riches. The resource curse has many complex economic and noneconomic aspects, but, as Jeffrey A. Frankel notes in a 2010 survey of the literature, institutional weakness is one of the most widely observed. A popular explanation is that in resource-rich countries, politics is reduced to a struggle to capture resource rents, whereas in resource-poor countries, governments must motivate people to create wealth and must provide the institutional framework in which they can do so.
Strictly speaking, there is nothing in the data shown in Figure 2 that would allow us to draw any causal conclusions regarding the relationship between wealth and government quality. Market-oriented writers do not hesitate to express a belief that rule of law, protection of property rights, and so on are the cause of superior economic performance. However, it is likely that there is feedback in the other direction as well, inasmuch as more prosperous and better-educated citizens in countries higher up the curve might well have less tolerance for corrupt and unresponsive governments.
Better governments tend to be larger, not smaller
There is a widespread tendency for governments with high QoG ratings to be relatively large, as measured by the share of government revenue or expenditure in GDP. Across all countries in our sample, the correlation coefficient for QoG9 and revenue share is 0.80. If we omit the petro-states, which, as we saw in the last section, have a distinctive political economy of their own, the correlation rises to 0.87. If government expenditures rather than revenue are used as the measure of the size of government, the correlations are very slightly lower, but with the same signs and still strongly statistically significant.
However, a question immediately arises about how much confidence should be placed in them, since both QoG and the share of revenue in GDP increase as GDP per capita increases. Because of this confounding variable, The simple correlation of quality with size of government could be spurious. Conceivably, even the sign of the correlation could be misleading. It might be the case, for example, that rich countries have high quality government despite the fact that their governments are large, and that small governments might be inherently better, holding GDP constant.
One way to sort out this three-way relationship is to look at a multiple regression using QoG as the dependent variable and both GDP and the share of government revenue in GDP as independent variables. For the sample of non-petro countries, such a test yields a multiple correlation of 0.88 and coefficients for both the GDP and revenue variables that are positive and statistically significant (p < 0.001). The partial correlation of QoG9 with the revenue share, controlling for GDP, is 0.32 (p < 0.001)
It appears, then, that even when we control for the effects of GDP per capita, better governments tend to be larger, rather than smaller. The data point strongly toward rejection of Thoreau’s view that “that government is best which governs least” and of Grover Norquist’s modern variant, that we can improve government by making it small enough to “drown in the bathtub.”
To be sure, the fit between QoG and size of government is not airtight. There are outliers, as shown in Figure 3. The chart covers all non-petro countries, with selected outliers highlighted in red. The trendline is based on all points, both red and blue. The axes show standardized values, with scales indicating standard deviations above or below the means for each variable.
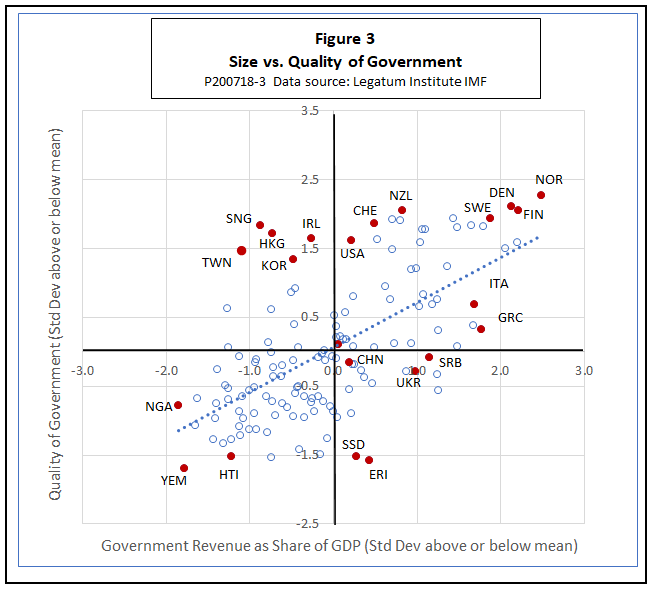
Starting in the northeast quadrant, we are not surprised to find that four Nordic countries have the most prominently large and high-quality governments. New Zealand, Switzerland (CHE), and the United States have governments that are also very high quality, but are only a little larger than average, as measured by revenue. Italy and Greece also fall in this quadrant, but below the trend line. Their governments, although large, are not as good as we would expect them to be based on their size alone.
The northwest quadrant, much less heavily populated, consists of governments of higher-than-average quality and smaller-than-average size. These countries are given high marks on the economic freedom rankings of organizations like the Fraser Institute, the Cato Institute, and the Heritage Foundation. There is no doubt that they are prosperous and well-governed, especially the five that are highlighted as red dots, but the comparatively small size of their governments, as ranked according to the share of revenue in GDP, should not necessarily be accepted at face value.
Ireland is a special case, in that it has one of the highest ratios of gross national product to gross national income of any country in the world. That is because more than a quarter of its GDP consists of the profits of international companies like Apple and Google that use Ireland as a tax haven. If we were to adjust for this “phantom” GDP and base the chart on GNI instead, Ireland’s ratio of tax revenue to income would be high enough to move it over into the northeast quadrant.
Hong Kong is another special case. For one thing, it is not an independent country, so it does not bear costs such as national defense and maintaining a full world-wide diplomatic presence. Also, as mentioned before, it seems likely that its high QoG rating is under threat from recent events.
The other three East Asian countries highlighted in the northeast quadrant have a trait in common that tends to exaggerate the difference between the size of their governments and those of their European peers. Both the East Asian and the European countries that are highlighted in Figure 3 have high-quality, comprehensive health care systems, but they are financed differently. The European health systems are supported directly by taxes, so the costs of maintaining them are reflected in the share of government revenue in GDP. In contrast, their East Asian counterparts are based on compulsory private insurance. Replacing a tax with a mandatory premium paid to a private insurance company means that the stream of payments bypasses the government budget. But is there any real difference between a compulsory premium and a tax? Some might say there is not.
Turning now to the southeast quadrant, we find countries that have large but low-quality governments. There are relatively few of these. In some, like Serbia and Ukraine, citizens pay higher-than-average taxes without getting much in return by way of quality government. Others, like South Sudan and Eritrea, display even worse governance without even the compensation of low taxes. China also falls into this quadrant, but is very close to the center.
Finally, the southwest quadrant contains a large number of countries where taxes are low but the quality of government is low, too. Yemen, Haiti, and the Democratic Republic of Congo offer little for fans of small government to admire. Nigeria and a few others at least manage to make it above the trendline, showing slightly better governance than we would expect, given their poorly funded public sectors.
Quality of government, human needs, and freedom
So far, this statistical portrait has focused on factors that tend to strengthen the institutional foundations of governance. However, quality of government is not an end in itself. Political theorists and activists throughout history have promised us that QoG is good because it makes life better.
Rothstein investigates the material benefits of good government in Chapters 2 and 3 of his book. He concludes, both from his own analysis and from previous literature, that life is indeed better in many ways where quality of government is high. This section presents further evidence that basic human needs are better satisfied and personal freedom is greater where QoG is high.
The first step was to use the Legatum data set to construct a measure of the degree to which basic human needs are satisfied in a given country. In doing so, I was guided by Abraham Maslow’s hierarchy of needs. Maslow proposed that human needs can be organized in a pyramid, beginning at the base with physiological needs like food and shelter, progressing to needs for safety and security, then love and belongingness, then self-esteem and esteem from others, and finally what he called “self-actualization,” by which he meant achieving one’s full potential.
My measure of basic needs focuses on needs in the two lowest levels of the Maslow hierarchy. Following the same statistical approach used to construct the QoG variable, I settled on a NEEDS variable that is the simple average of the following twelve elements from the Legatum data set:
- Health care systems
- Preventive interventions
- Physical health
- Longevity
- Basic services
- Connectedness
- Material resources
- Nutrition
- Protection from harm
- Shelter
- Property crime
- Violent crime
A regression of NEEDS on the log of GDP, QoG9, and the size of government yielded a coefficient of multiple correlation of 0.94, regardless of whether the share of government revenues or expenditures was used as the measure of the size of government. The coefficient on all of the independent variables was positive and statistically significant. (See the online appendix for details.) The partial correlation of NEEDS with QoG9, controlling for GDP and government expenditures, was a statistically significant 0.32 (p < 0.0001). The partial correlation of NEEDS with government expenditure, controlling for GDP and QoG9, was 0.28, also statistically significant but slightly lower than that for NEEDS and QoG9.
In short, the satisfaction of basic needs increases with higher quality and larger size of government; QoG has a significant independent effect on need satisfaction even when controlling for the effects of higher GDP and higher government expenditures; and QoG has a somewhat stronger effect on need satisfaction than size of government. All of these results are consistent with my own earlier research on the issue [1] [2].
Turning now to personal freedom, the Legatum Prosperity Index contains its own measure, based on freedom of assembly and association; freedom of speech and access to information; absence of legal discrimination; social tolerance; and an element Legatum calls “agency,” which measures individual rights, freedom of movement, women’s rights, forced labor, and other indicators. For present purposes, I dropped the social tolerance element, partly because, in contrast to absence of legal discrimination, it appeared to be based more on cultural attitudes than on public policy, and partly because factor analysis suggested that social tolerance was less consistently associated with the freedom group than were the other four elements. That left me with a variable PFREE, which is the simple average of four Legatum elements:
- Freedom of assembly and association
- Freedom of speech and information
- Absence of legal discrimination
- Agency
For comparison, some readers may be familiar with a personal freedom index published by the Cato Institute. For the 157 countries for which both the Cato personal freedom and my PFREE measure are available, the correlation coefficient is slightly over 0.90. That is no real surprise, since they are conceptually similar and share some of the same underlying indicators.
A multiple regression of PFREE on log GDP, QoG9, and a measure of the size of government gives a coefficient of multiple correlation of 0.79. It makes no difference whether expenditure or revenue is used as the indicator for size. The coefficients for log GDP and QoG9 are highly significant (p < 0.0001) while those for either measure of size are only marginally significant ( .01 < p < 0.05). The partial correlation of QoG9 with PFREE, controlling for log GDP and government expenditure, is 0.67, suggesting that quality of government is responsible for a substantial part of cross-country differences in personal freedom. The partial correlation of GREV with PFREE, controlling for log GDP and QoG9, is just 0.17, indicating that personal freedom increases as the size of government increases. That is still statistically significant, but it suggests that quality of government has a much stronger effect on personal freedom than does the size of government. That, again, is consistent with my earlier research.
Conclusions
This statistical portrait reaches a number of conclusions about quality of government, as defined to include rule of law, integrity, and other measures of impartiality and competence.
We have seen that, on the whole, QoG tends to be higher in countries that are more democratic. To no one’s surprise, we have found that rich countries tend to be better governed than poor countries, although countries that are heavily reliant on natural resource wealth are distinct outliers in that regard. Finally, we have seen that better governments tend to be bigger, as measured by the size of their budgets relative to GDP. The data give little support to the idea that slashing government budgets is a reliable way to improve government quality.
We have also found that in key respects, life is better in countries that have high-quality governments, and even more so when those governments are both higher-quality and larger. That is true both when a “better life” is defined in terms of the satisfaction of basic human needs and when it is defined in terms of human freedom. In all these respects, the results are consistent with the preponderance of findings in previous literature in the subject, including my own earlier work.
To put it succinctly, that government is best that governs best.
Originally published by Niskanen Center. I would like to thank Niskanen Center intern Masud Alam for help in preparing this commentary.
Nice Post,
ReplyDeleteStay assured that each of the commercial law essay and assignment papers will be referenced to perfection. Our in-house experts are well-aware of the conventions in Chicago, MLA, Harvard, and Vancouver style citations.