On December 4, I made a presentation to a student group on Carbon Pricing and Its Enemies. Here is a link to the slides for the presentation. Watch this space for a narrative version, hopefully available soon,
Wednesday, December 4, 2019
Friday, November 15, 2019
Can We Put Everyone to Work?
Temporary link to slideshow "Can We Put Everyone to Work," presented at Economic Club of Traverse City, MI, November 15, 2019.
A detailed narrative version of the presentation is now available at NiskanenCenter.com
A detailed narrative version of the presentation is now available at NiskanenCenter.com
Monday, October 28, 2019
Can Pete Buttigieg Save Democrats from the Medicare for All Trap?

The Democratic Party is at risk of falling into a trap on
health care — a trap called “Medicare for All.” But at the Democrats’ October
15 debate for presidential candidates, Pete Buttigieg offered a plan that could
allow a timely escape.
Buttigieg began by characterizing his plan, Medicare
for All Who Want It (M4AWW), as one that “trusts you to make the
right decision for your health care and for your family. Unlike the purist form
of Medicare for All promoted by Warren and Bernie Sanders, Buttigieg maintained
that his plan could be “delivered without an increase on the middle-class
taxes.”
Warren replied, “So, let’s be clear. Whenever someone hears
the term Medicare for All Who Want It, understand what that really means. It’s
Medicare for all who can afford it,” clearly implying that M4AWW would leave
some Americans still unable to afford the health care they need.
This attack on the Buttigieg plan misses the mark. Contrary
to Warren’s claim, the approach taken by Buttigieg — and shared by several
related reform proposals — would not, regardless of their income, leave out
“the family whose child has been diagnosed with cancer” or “the person who’s
just gotten an MS diagnosis.” It would instead protect everyone from ruinous
medical bills, but do so in a way that avoids, as Buttigieg puts it, blowing a
“giant multi-trillion-dollar hole” in the federal budget.
All this is easily understood by anyone who takes the time
to see how Medicare for All Who Want It, and related proposals, actually work.
Here are some of the plan’s key points.
Friday, October 11, 2019
What Can Welfare Experiments of the 1970s Tell Us About a UBI?

In a recent commentary, I examined
what economic theory can tell us about the effects a universal basic income
would have on work incentives. But theory alone is not enough. We need also to
look at evidence. The following will review the evidence from a set of
experiments that were conducted in the 1970s as part of an attempt to make
antipoverty policies of that era more effective.
These welfare experiments — or income maintenance
experiments (IMEs) as we should more properly call them — were true
randomized field trials. Such trials are considered the gold standard for
testing new medicines or new crop varieties, but they are used all too rarely
for testing economic policies. (By way of exception, another
set of welfare experiments were conducted in the 1990s in conjunction
with the welfare reforms of the Clinton years.)
Critics often say that UBI supporters pay insufficient
attention to the IMEs. As Bryan
Caplan puts it, in a recent piece for at the Library of Economics and
Liberty,
If I were an enthusiastic UBI advocate, I would know this experimental evidence forwards and backwards. Almost all of the advocates I’ve encountered, in contrast, have little interest in numbers or past experience. What excites them is the “One Ring to Rule Them All” logic of the idea: “We get rid of everything else, and replace it with an elegant, gift-wrapped UBI.” For a policy salesman, this evasive approach makes sense: Slogans sell; numbers and history don’t. For a policy analyst, however, this evasive approach is negligence itself. If you scrutinize your policy ideas less cautiously than you read Amazon reviews for your next television, something is very wrong.
Writing on the Heritage Foundation website, Robert Rector and Mimi
Teixeira echo Caplan’s sentiments. They point to the IMEs of the 1970s to
support their view that a UBI would harm recipients and increase dependence on
government. Their conclusion:
Universal basic income policy is an idea with a record of failure; policymakers seeking to reform the welfare state should focus instead on policies proven to work.
But are those really the lessons of the IMEs?
Thursday, October 3, 2019
Would a UBI Reduce Work Incentives? Some Answers from Econ 101

More than half of all U.S. college students take a
basic economics course. A lot of them hate it. The course is full of graphs and
charts. That would be bad enough, but what makes it worse is that the graphs in
a typical Econ 101 textbook are about boring stuff — whether a farmer should
grow beans or peas, whether a student should eat pizza or burritos for lunch.
Who cares?
But, what if we put those Econ 101 tools to work on
something we do care about — something like a Universal Basic
Income? Then things could get interesting. Read on to see how we can use some
basic econ graphs to answer one of the most frequently asked questions about
basic income: Would a UBI reduce work incentives?
How our welfare system kills work incentives
We can begin by showing how our current welfare system kills
work incentives. Welfare as we know it is based on means testing.
The concept of means testing, as applied to programs like SNAP, TANF, and
Medicaid, is that if you are really poor, the government gives you benefits,
but if you try to work and get ahead on your own, the government takes your
benefits away. Not surprisingly, that is not the way to encourage work.
Rather than go through the incentive effects of existing
programs one by one (I’ve done that elsewhere), this post will keep things simple by looking at
a generic means-tested income support (MTIS) policy.
Tuesday, October 1, 2019
How Generous a Basic Income Could We Afford?

Summary: Basic income advocates often
encounter the objection, “We can’t afford it!” To counter that objection
convincingly, they need to address several key questions:
- What
resources can a basic income draw upon? Which existing income support
programs would be rendered unnecessary if an adequate basic income were in
place?
- How
would a basic income mesh with other social programs, especially health
care, child care, and social security?
- Who
would be eligible for a UBI? The entire population? Citizens only? Adults
only?
- Does an adequate basic income have to be generous enough to raise everyone out of poverty by itself, or would something less than that be enough?
__________________________________________
In search of a baseline UBI
To many people, a universal basic income (UBI) sounds like a
good idea — until you start thinking about whether we could afford it.
Robert Greenstein, President of the Center for Budget and
Policy Priorities, is no enemy of robust government programs to help the poor, yet he is an outspoken critic of a UBI. Affordability is Greenstein’s number one concern. He argues that giving a UBI of $10,000 a
year to the entire U.S. population of 327 million people would cost $3.27
trillion, about equal to the entire
annual revenue of the U.S. government. It’s hard to imagine that
such a UBI would advance very far, he says.
But is asking whether we could afford a UBI of any given
size really the right question? A more sensible starting point might be to
ask how much basic income we could afford if we used only what the government
is already spending on income support, without raising taxes or total spending
at all. The answer to that question gives us a baseline UBI that
that we can use as a point of reference.
Determining how generous that baseline UBI would be involves
two steps: First determining how much money could be made available by
redirecting existing income support spending to a basic income (the numerator),
and second, determining how many people would be eligible to receive benefits (the
denominator). The baseline UBI is then equal to total funds divided by the
eligible population.
Here goes.
Thursday, September 12, 2019
Latest Data on Poverty and Inequality Show Small Improvements but No Break in Long-Term Trends

On Tuesday, the Census Bureau released the latest data on poverty and
income distribution for U.S. households. They show small improvements for 2018
compared with the year before, as would be expected with unemployment nearing
50-year lows. However, the short-term gains were not large enough to constitute
a break with long-term trends.
One piece of welcome news was a drop in the percentage of
people living in poverty from 12.7 percent in 2017 to 11.8 percent in 2018.
Still, as the following chart shows, the 2018 poverty rate remains above the
lows reached in the 1970s and again at the turn of the century. The longer-term
trend of the official poverty rate since the late 1960s remains upward even
when recent decreases are taken into account.

The official poverty rate is only one of several ways of
looking at income distribution in America. The Gini
index provides another perspective. This statistic varies from a
possible value of zero, when distribution is perfectly equal (like a cake cut
into equal slices) and 100 for a winner-take-all situation (like a hand of
poker where the winner gets everyone else’s chips). The same statistic is
sometimes on a scale of zero to one, in which case it is called the Gini
coefficient or Gini ratio.
Tuesday, September 3, 2019
What Explains Voter Aversion to Carbon Taxes?
 Despite widespread support among economists
of all political persuasions, polling shows public attitudes toward putting
a price on carbon emissions to be lukewarm, whether you call it a tax, a fee, a
user charge or anything else. A Hill+Knowlton survey found that although 81 percent of
Americans respond positively when asked if they favor government action to
limit carbon emissions, support falls to 56 percent when they are asked whether
they favor a carbon tax.
Despite widespread support among economists
of all political persuasions, polling shows public attitudes toward putting
a price on carbon emissions to be lukewarm, whether you call it a tax, a fee, a
user charge or anything else. A Hill+Knowlton survey found that although 81 percent of
Americans respond positively when asked if they favor government action to
limit carbon emissions, support falls to 56 percent when they are asked whether
they favor a carbon tax.
Conservatives are not the only ones who are skeptical.
According to a YouGov
Blue poll, people who identify as Democrats have greater-overall support
for climate action than do Republicans, but even they prefer an approach that
emphasizes public investment and regulation over any kind of carbon tax or fee.
A Politifact analysis of climate policies as stated on
campaign websites found that only six of the 21 Democratic candidates who
participated in the June and July debates offered explicit support for a carbon
tax.
Nor is aversion to carbon taxes limited to the United
States. A comprehensive cross-national review of climate policy opinion by Stefano
Carattini, Maria Carvalho, and Sam Fankhauser, “Overcoming
Public Resistance to Carbon Taxes,” (Carattini) finds similar attitudes
both in the United States and abroad.
In what follows, I will try to address the issues that these
polling data raise for economists, myself included, who see carbon taxes as
“obviously” the best tool of climate policy. Why is it that so many
members of the public are skeptical, even when they strongly favor climate
action? How can carbon tax backers improve their communication strategies?
Monday, August 19, 2019
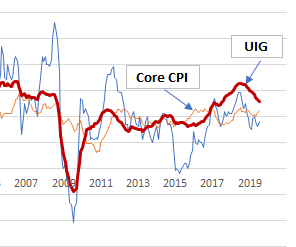
A Little-Noticed Inflation Indicator That is Worth a Closer Look
 As talk of a new recession grows louder, everyone is
watching some favorite indicator. The yield curve, claims for unemployment, the
quits rate — you name it. What surprises me is how few people are watching an
underappreciated indicator from the New York Fed that uses more than just price
data to tell us what is happening with inflation.
As talk of a new recession grows louder, everyone is
watching some favorite indicator. The yield curve, claims for unemployment, the
quits rate — you name it. What surprises me is how few people are watching an
underappreciated indicator from the New York Fed that uses more than just price
data to tell us what is happening with inflation.
What makes the Underlying Inflation Gauge (UIG) unique is
its power to distinguish between changes in the cost of living and changes in
the rate of inflation. Did you think those were the same thing? Think again,
and read on.
What’s the difference?
The concept of the cost-of-living stems from the first of
those role of money as a medium of exchange. When we say the cost
of living increases, we mean that it gets harder to maintain a given standard
of living on a given income. Either we have to be satisfied with fewer goods or
services, or save less, or work harder. In the language of economics, a change
in the cost of living is a real phenomenon.
Inflation, in concept, is best understood a change in the
value of our unit of account, the dollar. When there is inflation,
the value of the unit is smaller each day than it was the day before, for all
transactions.
Imagine that you woke up one morning to find that someone
had chopped an inch off all our rulers, so that today’s foot was now only as
long as yesterday’s eleven inches. You might go from being six feet tall to
six-foot-six, but it wouldn’t be any easier for you to reach the top shelf in
the kitchen without a footstool. Similarly, if inflation raises both your
income and the prices of everything you buy by the same percentage, the value
of a dollar as an economic ruler shrinks, but it is neither harder nor easier
to maintain the same real standard of living. In that sense, inflation does not
measure anything real. It is a purely nominal phenomenon.
Saturday, August 17, 2019
Investment and Exports Explain Why the economy Isn’t Taking Off Like a Rocket

What went wrong? First, let’s see what happened and then
speculate about why.
What: Weak fixed investment
Backers of the big cut in corporate tax rates promised an
investment boom. Companies were supposed to use the money they saved in taxes to
build new plants and buy new equipment – what government statisticians call
“fixed investment.” That didn’t happen.
Sunday, August 4, 2019
Trends in the Distribution of Weath Are Even Scarier Than Trends in Income

“We have an economy in this country that is not working for
working people,” says Sen.
Kamala Harris, a Democratic candidate for President. It is a common
refrain. As the following chart shows, when adjusted for inflation, average
hourly earnings of ordinary U.S. workers have grown just 15 percent over the
past 30 years. Weekly earnings of full-time employees have grown even less,
just 10 percent.

No wonder a lot of Americans are feeling left behind by a
booming economy. But wages are not the whole story. Would you believe, there
are other data that make the “left behind” narrative look even worse?
It’s not the wages, it’s the wealth
The trend that is even scarier than that of wages is the
trend in wealth. “Wealth,” in this sense, means net worth, that is, total
assets minus total debts. It’s not what you own that matters, but the
difference between what you own and what you owe.
Tuesday, July 23, 2019
It's Time to Phase Out Employer Sponsored Health Insurance. Here's How.

A few month ago, I wrote a post explaining why employer
sponsored health insurance (ESHI) has been called the original
sin of the U.S. health care system. This post now turns to some ideas for
escaping the ESHI trap.
Close to half of all Americans receive health insurance
coverage through their jobs. In no other major country is health care coverage
tied as closely to employment as in the United States. American-style ESHI has
three major unintended consequences.
- “Job
lock” makes workers afraid to move to a more suitable job, to become
self-employed, or to start one’s own business for fear of losing insurance
coverage.
- ESHI
is severely inequitable. Health insurance benefits are tax-deductible, but
the deduction is of greater value to people in higher tax brackets, and
higher-paid workers are far more likely to get health benefits to begin
with. Those in the top fifth of the wage distribution are
estimated to get ESHI benefits that are nine times higher than
those of the bottom fifth.
- The
existence of thousands of ESHI plans, some of them quite small, adds to
the fragmentation of the U.S. health care system and contributes to high
administrative costs.
Any worthwhile strategy for health care reform needs a
strategy for escaping the ESHI trap.
The Non Sequitur in Sanders' Case for Medicare for All

During June’s Democratic
debate, moderator Lester Holt asked Bernie Sanders a question about
Medicare for All. Sanders replied:
Lester, I find it hard to believe that every other major
country on Earth, including my neighbor 50 miles north of me, Canada, somehow
has figured out a way to provide health care to every man, woman, and child,
and in most cases, they’re spending 50 percent per capita what we are spending.
Taken at face value, the statement is close enough to pass
for true by the standards of contemporary political discourse. But as a defense
of Medicare for All, it is a non sequitur.
The reason: No other major country offers a plan that is
anything like Medicare for All.
Here is a chart, based on data from the Commonwealth
Fund, that compares the United States with 10 other major countries in
terms of heath care spending and health care performance.

Yes, all countries shown have better health care outcomes
than the United States, and all spend less (although more than half as much).
But how closely do their health care systems resemble Medicare for All? How
broad is their coverage? How centralized are they? What role do they assign to
private insurance? What do they require by way of premiums and cost-sharing?
Here are some answers, starting with the three top performers. (See
here for the full health system profiles of each country.)
Sunday, June 16, 2019
Medicare for America: A Health Care Plan That Deserves a Second Look

Last December two Democratic representatives, Rosa DeLauro
of Connecticut and Jan Schakowsky of Illinois, introduced a health care reform
bill called Medicare for America. At the time, it got relatively little
publicity, but now that it has been reintroduced as
H.R. 2452, it deserves a closer look.
Medicare for America (or M4Am, for short) is increasingly seen as a pragmatic option for Democrats
who want to stake out a slightly more centrist position than the party’s
progressive superstars. For those with low incomes and chronic illnesses, M4Am,
like Senator Bernie Sanders’ Medicare for All, would provide free first-dollar
coverage for a wide range of medical, dental, and vision services. Unlike the
Sanders plan, though, it would subject people with higher incomes and lower
medical expenses to income-based premiums and cost sharing.
Here are some of the key features of M4Am, followed by some
suggestions that could further improve its prospects for support from a broad
range of the political spectrum.
Medicare for America and Universal Catastrophic Coverage
Medicare for America belongs to a family of health reform plans
known generically as universal catastrophic coverage (UCC). The aim of UCC
is to protect everyone against financially ruinous medical expenses though full
first-dollar coverage for the poorest and sickest, while requiring income-based
cost-sharing from those who can afford it. UCC posits a robust role for the
government as a provider of social insurance where needed, while creating
adequate scope for market mechanisms where they have the best chance of
working.
Sunday, June 9, 2019
The Economics of a Job Guarantee

A federal job guarantee (JG) is one of the hardy perennials
of American politics. Such a guarantee would offer public-service employment
(PSE) to anyone who wanted it, with government at some level or an approved
nonprofit organization as the employer.
The idea of a job guarantee traces its roots to the Great
Depression, when the federal government created thousands of jobs through
programs like the Works Progress Administration and Civilian Conservation
Corps. Later, in his 1944 State of the Union address, President Franklin
Roosevelt put the right to a job at a living wage at the very top of his “Second Bill of Rights.” In the 1970s, a job guarantee was again
proposed as part of the Humphrey-Hawkins
Full Employment Act, although it was dropped from the draft before that
bill was passed.
Today, the idea is undergoing a revival as part of the Green New Deal, introduced in Congress in 2019 with more
than 100 co-sponsors. Some might find the timing odd, with the unemployment at
a 50-year low. In reply, however, JG proponents point to three gaps that
persist even when official data point to a tight labor market:
- A hidden
unemployment gap: A gap between the number of people counted in
the labor force and the number who would seek work if jobs were available
at a higher wage.
- A pay
gap: A difference between what people are now paid and the
maximum that their employers would be willing to pay if necessary.
- A public
service gap: A large, unmet need for labor-intensive public
services that would generate benefits equal to or greater than the cost of
providing them.
This three-gap model of the labor market will serve as a
convenient device for organizing this commentary on guaranteed jobs.
Thursday, June 6, 2019
Joe Biden Commits to Decarbonization but Not To a Carbon Tax

Joe Biden’s climate action plan is
a passionate declaration of good intentions. Unfortunately, all the passion is
undermined by his failure to openly support a carbon tax, the one policy that
would most certainly deliver on his promises.
Politics should be about means, not just about ends.
Ends-wise, Biden’s program is a veritable feast. He sets an overall goal of net
zero carbon emissions by 2050, matching the goal set by the Green New Deal of
his progressive rivals, and he makes a gazillion specific promises along
the way:
- 100% electric cars
- advanced biofuels
- carbon free aircraft fuels
- more compact cities with
higher-density affordable housing
- grid-scale storage at one-tenth the
cost of lithium-ion batteries
- small modular nuclear reactors at half
the construction cost of today’s reactors
- refrigeration and air conditioning
using refrigerants with no global warming potential
- zero net energy buildings at zero net
cost
- using renewables to produce
carbon-free hydrogen at the same cost as that from shale gas
- decarbonizing industrial heat needed
to make steel, concrete, and chemicals and reimagining carbon-neutral
construction materials
- decarbonizing the food and agriculture
sector, and leveraging agriculture to remove carbon dioxide from the air
and store it in the ground
- capturing carbon dioxide from power plant exhausts followed by sequestering it deep underground or using it make alternative products.
That’s not even the full list. All those ends are laudable,
but the proposed means turn out to be just an ad hoc mix of
executive orders, restoration of Obama-era regulations, research subsidies, and
tax credits.
The trouble is that such a program lacks any way of
balancing the costs of decarbonization among the various possibilities. Maybe
there will be breakthrough on advanced biofuels that makes liquid-fueled cars
just as clean as electrics, and cheaper to run. Maybe direct air capture of
carbon will turn out to be more efficient than carbon capture from industrial
smokestacks. Who will choose which paths to pursue and which to abandon?
Tuesday, May 14, 2019
A Shopping Trip to the Past Reveals an Important Truth About Inflation

Inflation has been pretty well contained lately, averaging
well below the Fed’s target rate of 2 percent. But could the true rate of
inflation be even lower than that? In a recent piece for The Wall Street Journal, Andy Kessler
explains why.
Kessler sees quality adjustment as the big flaw in the CPI
and other standard inflation. Government statisticians try to make quality
adjustments, but, as Kessler says, “by the time the BLS puts something new in
the CPI basket, it’s already cheap.” As a result, he thinks, the CPI overstates
the true rate of inflation by about 2 percentage points.
Is he right? Even the best econometricians aren’t sure.
That’s not because they aren’t good at what they do. Rather, it’s because
quality adjustment is fundamentally subjective.
With that in mind, I’ve developed my own purely subjective
approach to gauging inflation, based on a fantasy shopping trip to the past.
Off you go, into the time machine. All I ask is that you bring back an answer
to this question:
If you could choose between shopping today at today’s prices, or shopping in the past at past prices, what items, if any, would you buy from the past?
Although I can’t give you a seat in a real time machine, I
can give you the next best thing: An old Sears Catalog. A great website, www.wishbookweb.com,
keeps an archive of page-by-page images for these “Wishbooks” going all the way
back to 1937. I won’t take you back that far, just to 1962. I pick that year
because that was before the “Great Inflation” of the 1960s and 1970s, which
tripled the U.S. consumer price level over the next two decades. All prices
quoted from the 1962 catalog are the actual nominal prices of that year, with
no adjustments for inflation.
Let’s go shopping!
Sunday, May 12, 2019
In Search of a Better Measure of Labor Market Slack

Every month we watch for changes in the unemployment rate.
Most people cheer when the unemployment rate falls — how can we not like it
when more of those who want to work can actually find a job? But low
unemployment makes economists and policy makers nervous. Is there enough slack
for further growth? Is the economy overheating? Does the Fed need to apply the
brakes?
To understand what is really going on, we we need to think
more about whether the official data from the Bureau of Labor Statistics are
really the right numbers to cheer or to get nervous about. Not necessarily.
Here is a short tutorial on how the government measures the degree of slack in
the labor market, and how it could be done better.
How the BLS measures labor market slack
The standard unemployment rate counts people as unemployed only
if they are not working but have actively looked for work in the previous four
weeks. That leaves out two important reserves of willing labor.
Wednesday, May 1, 2019
Rep. Paul Tonko's Nine Principles of Climate Change are a Call to Action. So Let's Act!

Rep. Paul Tonko, who
chairs a House subcommittee on Environment & Climate Change
Subcommittee, has published a list of nine
principles of climate action. He prefaces
his list with these remarks:
Americans
are living, and dying, in the path of unprecedented flooding, raging wildfires,
and battering storms driven by Earth’s changing climate. Regardless of the
origins of our predicament, we have inherited these conditions. It falls to us
to set aside past disagreements and rise together to meet this challenge. We
agree that climate change is real.
We
agree humans are driving it. We agree that we need to build solutions that meet
the scale and urgency of the crisis we face. The principles outlined in this
document are meant to provide a framework that moves the lines of our agreement
forward and helps us build a comprehensive national climate action plan
together.
As
we assess the ideas before us, no options should be off the table. Rather, I
submit that any climate proposal we consider should be measured against the
principles enclosed here. They reflect extensive conversations with Members of
Congress and stakeholders. I present them to you for your consideration,
reflection, and feedback.
As a strong backer of climate action, here are my
responses. (Words in italics at the beginning of each section are Tonko’s,
either full quotes or slightly edited for length.)
1. Adopt Science-Based Targets for Greenhouse Gas
Neutrality by Mid-Century
We certainly need a radical reduction in GHG emissions by
mid-century, but full net carbon neutrality may be an overreach. Emissions
reduction, like many economic and engineering processes, tends to follow an
80/20 pattern, wherein the first 80 percent of the cleanup absorbs half the
cost while the remaining 20 percent costs as much again as the first 80. Even
within the last 20 percent, most of the cost is in the last few percentage
points. For example, something like the schedule of reductions given in HR 763, a fee-and-dividend approach backed by the Citizens’ Climate Lobby, which calls for roughly an 88
percent reduction by 2050, would be more realistic.
Friday, April 5, 2019
The Green New Deal: Aspirations and Alternatives

It was never intended as a piece of legislation. It would more accurately be described as an assemblage of aspirations regarding the environment, jobs, health care, and the treatment of oppressed communities. It attracted more than 100 sponsors in the House. On the Senate side, it attracted the co-sponsorship of all six sitting members running for the Democratic nomination and several others.
Then, on March 27, Majority Leader Sen. Mitch McConnell forced an actual floor vote on the Green New Deal. It did not attract a single "yes" vote. Nearly all Democrats, including all six co-sponsors of the bill, voted "Present." Republicans and a handful of red-state Democrats voted "No."
What does it say of a resolution when even its own co-sponsors will not vote for it? To me, it says that there is a big gap between aspiration and implementation. Already, Democrats are turning away from the Green New Deal as a comprehensive package. They are looking for alternatives in the form of more specific, more pragmatic, more targeted legislation.
On April 3, I discussed all this and more in a talk at Michigan State University, sponsored by the American Enterprise Institute MSU Council and Kappa Omega Alpha. Here is the slideshow for the presentation. Comments and suggestions welcome!
Sunday, March 31, 2019
Why "Do No Harn" Should Be Fiscal Policy Rule No. 1

The 35-day government shutdown that kicked-off 2019 is only the latest indicator of the fiscal chaos that reigns in Washington. The chaos is reflected both in the failure of Congress to follow the procedural rules it has set for itself, and in a failure to provide a degree of fiscal stimulus or restraint that is appropriate to the state of the business cycle. Without better fiscal policy rules, the chaos will continue
Procedural rules are not enough
Congress does have rules to guide fiscal policy. The 1974
Budget Act specified a set of procedural rules that
Congress is supposed to follow each year in passing a budget. However, Congress
has passed the full set of appropriations bills on schedule
only three times in the past 40 years.
Even more problematic is the failure to align annual tax and
spending decisions, whether made on time or not, with long-run goals of
stability and economic growth. Attempts to address that problem have proved
inadequate.
Consider the debt ceiling,
first enacted more than 100 years ago. Even if we could accurately determine
the point beyond which debt becomes excessive, the ceiling in its current form
is unworkable. Since it is set in nominal terms, with no allowance for
inflation or growth of the economy, Congress must vote periodically to raise
it. That creates opportunities for various factions to disrupt the budgeting
process with brinkmanship over extraneous issues, even though everyone knows
that the consequence of not raising the ceiling — default on the debt — would
be so dire as to make the whole process a charade.
A more recent type of rule, known as pay-as-you-go, or PAYGO, has
fared little better. PAYGO has taken several forms since it was first
established in 1990, but the underlying idea is to require that tax cuts or new
spending be offset by tax increases or spending cuts elsewhere in the budget.
In case the necessary offsets are not made, sequestration — mandatory cuts to
already authorized programs — can be invoked to prevent an increase in the
deficit. In practice, however, Congress can, and does, waive PAYGO rules
whenever it wants to. For example, it used a waiver to allow the 2017 tax cut
to go into effect despite the resulting increase in the deficit.
Long-term rules for fiscal policy
If procedural rules are not enough, what would work better?
The answer is that if we want a more responsible fiscal policy, we will need to
rely less on the short-term impulses of politicians and more on policy rules
that target stable, sustainable growth. Here are three suggestions.
Rule 1: First, do no harm. The economic equivalent of this maxim is to aim for cyclical
neutrality, that is, one that that manages taxes and spending in a way that
avoids prolonging expansions or deepening recessions.
At first glance, it might seem that the ideal neutral policy
would be to keep the budget in balance at all times, as would be required by that
perennial favorite of congressional conservatives, a balanced budget amendment.
In reality, nothing could be worse. As I explained in an earlier
post, a balanced budget amendment would be profoundly pro-cyclical. To keep
the budget in absolute balance year-in and year-out would require tax increases
or spending cuts during downturns and spending increases or tax cuts when the
economy was at or above full employment. That would be the exact opposite of
“do no harm.”
In contrast, a cyclically neutral rule would take full
advantage of automatic stabilizers to moderate the business cycle. One form of
such a rule would be to hold the primary structural balance of
the budget at a constant target value over time. The primary structural balance
differs from the ordinary way of measuring the federal deficit or surplus in
two ways:
- The
“structural” part means that the actual surplus in any year is adjusted to
reflect the levels of tax receipts and spending that would prevail, under
current law, if the economy were at full employment. During a recession,
the actual balance is below the structural balance (that is, further
toward deficit) because of low tax revenue and high spending on income transfers.
When the economy is running hot, the actual balance is above the
structural balance (that is, further toward surplus).
- The
“primary” part of the term means that interest payments on the national
debt are disregarded. Although interest payments are a form of government
outlay, in the short run, they are not under the control of policymakers.
Instead, for any given level of debt, federal interest expenditures are
largely determined by market interest rates.
The target for the primary structural balance could be set
at zero, at a small surplus, or at a moderate deficit. The choice depends in
part on variables like the economy’s long-run rate of growth relative to market
interest rates, and also on whether policymakers want to hold total debt steady
as a share of GDP, to allow it to grow gradually, or to decrease it (for
details of the math behind the choice of targets, see
this slideshow). Under conditions that currently prevail in the U.S.
economy, a zero primary structural balance, or even a small deficit, equal,
say, to half a percent of GDP, would be sufficient to achieve cyclical
neutrality while ensuring that the debt ratio would gradually decrease.
“Do no harm,” of course, is a pretty low bar. In theory, a
rule that held the primary structural deficit at the desired level over the
business cycle but allowed temporary countercyclical tax and spending measures
on a discretionary basis would be even better. However, practical
considerations of lags and forecasting errors, not to mention political
temptations to do the wrong thing at the wrong time, provide grounds for
caution. The PAYGO waiver for the pro-cyclical 2017 tax cut, passed as the
economy was well on its way to full employment, is a case in point.
However, there is one important exception to the “no
exceptions” rule. A “do not harm” rule should allow for extra fiscal stimulus,
beyond the amount needed to hold the primary structural balance constant,
during periods when interest rates fall to the zero bound, rendering conventional
monetary stimulus ineffective. The 2009 American Recovery and Reinvestment Act
of 2009 would fit that specification (see here and here for
analysis of the ARRA and its effects).
Rule 2: Tax and spending reforms should be
consistent with macro targets. Fiscal policy has both a macroeconomic and a microeconomic
side. Rule 1, which calls for cyclical neutrality, serves the macroeconomic
goals of stability and growth. Microeconomic issues concerning the structure of
taxes and the composition of spending are also important, but they should be
approached in a manner that does no macroeconomic harm.
In particular, tax reform, whether aimed at removing
perverse incentives or improving distributional equity, should be carried out
in a way that is revenue-neutral over the business cycle. For example, cuts in
distortionary payroll or corporate-profits taxes could be offset by increases
in taxes thought to be less distortionary, such as consumption or carbon taxes.
Similarly, spending increases — even putatively growth-enhancing ones such as
infrastructure spending — should be accompanied by cuts to lower-priority
spending programs or appropriate tax increases.
Like its distant cousin PAYGO, this rule would require
Congress to consider impacts on the deficit when passing tax or spending
legislation. However, it differs from PAYGO in two important ways. First, it
would be symmetrical, in that it would not only bar inappropriate fiscal
stimulus when the economy is near full employment, but also inappropriate
austerity during a recession or the early stages of a recovery. Second, the
degree of offset for tax cuts and spending increases would vary with the
business cycle. The required offset would be less than 100 percent near the
bottom of the cycle and greater than 100 percent at or near the peak.
Rule 3: Fiscal rules should be neutral with
respect to the size of government. Conservatives often propose that any fiscal rule should
place a constraint on the overall size of government. For example, a 2011
version of a balanced budget amendment proposed capping federal
expenditures at 18 percent of GDP. Such a constraint would be a mistake.
Instead, any rule governing the path of the deficit or surplus over the
business cycle should be neutral as to the size of government as well as
neutral with regard to the cycle itself.
In reality, there is little evidence to support the idea
that small government is necessarily good government. On the contrary, as I
have discussed previously (see here and here),
the available evidence shows a negative correlation between the size of
government relative to GDP and broad measures of prosperity, personal freedom,
and economic freedom. Overall, quality of government, as measured by such
things as the rule of law, protection of property rights, and government
integrity, is more important for freedom and prosperity than the size of
government. Yet even if one believes a smaller government is better, such rules
inject a contentious ideological motive into the debate over how best to reduce
the debt level. A rule that is neutral to government size leaves the question
up to democratic debate, with the proviso that new structural spending must be
paid for.
The bottom line
It is not likely that the White House or Congress will agree
anytime soon to putting fiscal policy on autopilot, nor should they. Overly
rigid rules would do more harm than good if strictly enforced (as a balanced
budget amendment would be), or would invite so many waivers as to make them
meaningless (as in the case of debt ceilings and PAYGO). Yet between rules that
are too rigid and no effective rules at all, there is a golden mean.
Those who are in charge of fiscal policy could learn a lot
about the proper balance between rules and discretion by heeding the example of
the Fed. For years, there have been economists who have urged the Fed to
follow a more rules-based policy and others who resisted those urgings.
Speaking at a 2017
conference where both sides of the debate were thoroughly aired, Frederic
Mishkin, a former member of the Fed’s Board of Governors, argued that rules
vs. discretion is not an either-or choice. Instead, Mishkin sees the Fed as
moving toward a regime of “constrained discretion” — one that pays attention to
rules but permits departures from the rules in response to unexpected economic
shocks. He argues that as long as such a regime is backed by transparent
communication of policy goals and actions, it can avoid the disadvantages both
of pure discretion and of overly rigid rules. In fact, thisstatement on
the Board of Governors website amounts to an assertion that constrained
discretion is already the Fed’s official policy.
Other countries, such as Sweden and Chile,
have successfully applied constrained discretion to the management of
government deficits and debts over the business cycle. We could do so, too, if
we could find the political will. Let’s hope that it does not take another
recession or self-inflicted fiscal crisis to provide the impulse.
Based on a version posted earlier at NiskanenCenter.com
Saturday, March 30, 2019
How to Slow Climate Change Without Hurting the Poor

"Energy is the lifeblood of any economy,” writes H.
Sterling Burnett, a fellow at the Heartland Institute. “A carbon tax
would increase energy prices and thus cost jobs, making it difficult U.S.
companies to compete with foreign rivals and punishing the poor.”
The Manhattan Institute’s Robert Bryce agrees. In an article
for the National
Review, he tells us that a carbon tax would “disproportionately hurt
low-income consumers,” especially those who “live in rural areas and must drive
long distances to get to and from their job sites.”
The American
Energy Alliance echoes that sentiment, placing the “it will hurt
the poor” argument in the third spot on a list of 10 reasons to oppose carbon
taxes:
The carbon tax is by nature regressive, because it will raise the prices of gasoline, electricity, and other goods by the same dollar amount for all consumers, regardless of their incomes. This disproportionately affects the poor, because energy costs are a bigger portion of their overall budgets. A carbon tax will therefore hurt low-income families and seniors more than it will hurt middle- and upper-class households.
It is true, as we will see, that poor households do devote
larger shares of their incomes to energy than do those with higher incomes, but
there is more to the story than that. If we properly measure the impacts of
carbon pricing and look at the full range of policy alternatives, there is no
reason why concern for the poor should block policies to protect the
environment.
The wrong way to help the poor
Let’s begin with the conventional wisdom, which holds that
low-income households would be disproportionately impacted by a carbon tax
since they devote a relatively high share of their incomes to energy. For
example, a 2009 study by
Corbett A. Grainger and Charles D. Kolstad found such a pattern, as shown by
the blue bars in the following chart:

The population is divided into five income quintiles, from
lowest to highest. The blue bars show how many kilograms of carbon each
quintile emits per dollar of income; this proportion is much higher for the
lowest quintile than the highest, indicating that the poor do spend more of
their budgets on energy. But the red diamonds indicate the proportion of national carbon
emissions emitted by each quintile, and they move in the opposite direction. In
other words, as you move up the income ladder, a smaller portion of your budget
goes to energy, but you still emit more. As a result, the top income quintile
is responsible for almost 35 percent of total emissions, compared to just under
10 percent for the lowest quintile.
Even if we take these numbers at face value, it is clear
that forgoing a carbon tax in order to keep energy prices low is an absurdly
inefficient way to help the poor. Based on their share of national emissions,
the top two income quintiles would capture 58 percent of the benefits of such a
policy, compared to just 24 percent for the bottom two quintiles. The very
richest households would gain three-and-a-half times more than the very
poorest.
Furthermore, looking only at incomes and energy use gives a
misleading picture of the degree to which the effects of a carbon tax would be
concentrated on the poor. A more
recent study by Julie Anne Cronin, Don Fullerton, and Steven E.
Sexton took a different approach. Cronin et al. considered not only the direct
impact of a carbon tax on household energy prices, but also indirect impacts on
the prices of goods like housing, food, and clothing. In addition to income,
they also looked at the impact of carbon taxes in proportion to household
consumption expenditures, which are more stable from year to year than incomes.
They also accounted for the fact that transfer payments to low-income households
are indexed to rise automatically when prices increase, whether because of
general inflation or due to a policy change like a carbon tax.
When all of those factors are considered, Cronin et al.
found that the impact of a carbon tax is more equally distributed in proportion
to household income and consumption than the conventional wisdom assumes. As
the next chart shows, the burden of a carbon tax as a percentage of household
income varies only slightly, from 0.54 percent of income for the poorest income
decile to 0.46 percent of income for the wealthiest decile. If the calculation
is done as a percentage of consumption rather than a percentage of income, the
impact of a carbon tax on wealthy households is actually proportionally greater
than on poor households.

If we judge by the Cronin method rather than the earlier
Grainger method, the idea of helping the poor by keeping carbon prices low is
even more suspect. According to the Cronin data, the top two income quintiles
would capture 77 percent of the benefit of forgoing a carbon tax, rather than
the 58 percent they would capture based on the older data. Meanwhile, the
poorest two income quintiles would receive only 10 percent of the benefit of a
low-price policy, rather than the 24 percent they would get based on the older
data.
Still, though, a carbon tax would have some adverse effect
on the poor, even if its impact would not be as regressive as the conventional
wisdom suggests. If forgoing a carbon tax is the wrong way to help the poor,
what is the right way?
How to help the poor and the planet
The right way to assist low-income families would be to give
them extra income to pay the higher prices that a carbon tax would bring. Every
serious carbon pricing proposal that I have seen includes some such
compensation scheme.
For example, the Citizens’ Climate Lobby,
one of the leading backers of a carbon tax, proposes distributing the tax
revenue equally among the entire population as a “citizen’s dividend.” A group
of 45 prominent economists recently wrote an open
letter in support of a carbon tax that would take the same
approach.
Alternatively, some favor a revenue-neutral tax swap that
would offset carbon tax revenues by reducing the rates of other taxes. If
enough of the rate reductions were focused on payroll taxes or other taxes that
are disproportionately burdensome for low-wage households, the net impacts of a
revenue-neutral tax swap could be made neutral with respect to income, or even
moderately progressive. Still
other carbon tax backers propose distributing all or part of the
compensation in the form of increased benefits for existing income-support
programs, such as food stamps, Social Security, and the earned income tax
credit.
Finally, some backers favor spending carbon tax revenues to
address climate change directly, for example, by investing in clean-energy
infrastructure or adaptation. If the benefits of slowing climate change are
enjoyed equally by everyone, regardless of income, the distributional effects
of such a policy would be similar to those of a tax-and-dividend scheme.
If, as
is sometimes claimed, climate change hurts the poor disproportionately,
using carbon tax revenue for climate mitigation would could be even more
progressive than a citizens’ dividend.
These are not either-or options. Carbon tax revenue could be
divided in some way among all of them. In a report for the Brookings
Institution, Aparna Mathur and Adele Morris calculate that compensating
low-income households for the impact of a carbon tax could take as little as 11
percent of the tax revenues. In an analysis
of the 2018 Market Choice Act, researchers from Columbia University and
Rice University found that allocating 10 percent of carbon tax revenue to
transfers to the lowest 20 percent of income earners increased household wealth
and especially benefited younger workers.
However, Cronin et al. add a big caveat. They point out that
not all families in a given income bracket are equally affected. Those who live
in temperate climates use less energy for heating and cooling than do those in
more severe climates. People who commute to jobs use more energy than retirees
with equal incomes, and so on. The impacts from family to family within an
income bracket can vary more than the average effect of the tax across income
brackets. The implication is that to be sure that most in the poorest quintile
were not hurt, it would be necessary to spend more on compensation than Mathur
and Morris’s 11 percent, or to target compensation to regions or activities
with high carbon consumption.
One final point regarding compensation: The basic point of
carbon pricing is to incentivize conservation of energy, investments in
low-carbon technology, and other behaviors that reduce emissions. There is a
trade-off between compensation and incentives. On the one hand, to make
compensation more effective, it makes sense to tailor it to the specific
circumstances of beneficiaries, so that fewer are undercompensated or
overcompensated. On the other hand, it is important not to allow the
compensation plan itself to undermine incentives.
For example, low-wage workers who have to drive a long way
to their jobs will be more severely impacted by a carbon tax than those who
have access to public transportation or can work from home. It would be a
mistake, though, to automatically offer extra compensation in proportion to
miles driven, or to provide vouchers to allow purchase of gasoline at pretax
prices. Any such forms of compensation would remove incentives to move closer
to work, use public transportation, or buy a more efficient car. Similarly,
fully compensating people who live in hot or cold climates for their extra home
heating costs could erode incentives to make their homes more energy efficient
or even to move to more temperate areas.
The Bottom Line
When considerations both of efficiency and fairness are taken
into account, “It will hurt the poor” does not ever have to override “It’s good
for the environment.” In any democratic political system, there are going to be
differences of opinion on the relative priorities of distributional equity and
environmental protection, but to say we must abandon one goal to pursue the
other is simply false. It is perfectly possible to protect the environment and,
at the same time, to protect low-income consumers from any undue effects of
doing so.
Based on a version published previously by NiskanenCenter.com
How Universal Catastrophic Coverage Could Ease the Transition to Health Care for All

The vision of universal access to health care that lies behind Medicare for All has wide appeal. However, as David Brooks noted in a recent column for the New York Times, the problem is less the vision than the transition. Medicare for All, in both its Senate (Sanders) and House (Jayapal) versions seems designed without a thought to the problem of transition. If we can’t get there from here, what is the use of a glittering vision of health care reform?
Fortunately, Medicare for All is not the only path to affordable access to health care for all Americans. Our team at the Niskanen Center has been working on an alternative health care reform known as universal catastrophic coverage (UCC). UCC would cover the needs of the very poor and the very sick in full, as does Medicare for All. At the same time, it would also require those who can afford to do so to pay a fair share of their routine medical expenses through income-based deductibles, coinsurance, and copays. That gives UCC a greater flexibility that would ease many of the transition problems that Brooks lists.
Sticker Shock
The sheer cost of Medicare for All is one of the biggest obstacles to its adoption. As measured by the Kaiser Family Foundation, Public support for comprehensive national health care drops from 56 percent to 37 percent when people are told that it would require higher taxes.
Backers of Medicare for All point out, correctly, that most people would get those taxes back through lower premiums and out-of-pocket costs. But taxation is a leaky bucket. Taxes distort financial decisions made by families and businesses. There are administrative costs of collecting taxes and disbursing benefits. As a result, it takes more than one dollar in tax burden to support each dollar of benefits.
Because of the leaky bucket effect, it makes no sense to impose heavy new taxes on upper-income households and then give that money right back as health care benefits. That is all the more true since the benefit in Medicare for All are more generous than in other countries. Highly regarded health care systems, such as those in Australia, Singapore, and France, require at least modest deductibles or copayments. What is more, they do not cover as wide a range of services as Medicare for All would do.
By comparison, universal catastrophic coverage would cost at least 30 percent less than Medicare for All. Based on reasonable assumptions, the government could finance UCC entirely from funds it now spends directly on health care, plus funds that now go to mandated and tax-advantaged employer plans. The lower cost of UCC would greatly reduce the problem of sticker shock.
What Role for the Insurance Industry?
Observers like Brooks rightly worry about the impact of health care reform on the half-million-odd people who work in health insurance. The fragmented and adversarial nature of our health care payment system is a big part of the reason for its high costs relative to those our high-income peers. Any serious reform will, and should, have a big impact on the insurance industry.
Still, it would be possible to implement UCC in a way that would be less disruptive to the insurance sector and its employees than Medicare for All, under which the entire industry would effectively disappear.
Under UCC, many higher-income households would have deductibles and coinsurance of thousands or even tens of thousands of dollars. Many of them would probably choose to buy some form of supplemental insurance. Private companies would serve that market, much as they serve today’s market for Medigap coverage.
UCC could also create a role for private insurers as payment agents for the federal catastrophic program. For example, they could offer a private option, similar to Medicare Advantage, even if the Centers for Medicare and Medicaid Services administered the basic UCC program.
Instead, UCC could contract out all coverage to competing private insurers, as the highly-rated Dutch and Swiss systems do. Those countries regulate insurance companies much more tightly than the U.S. system currently does. The regulations ensure that companies compete by offering lower costs and better customer service, rather than boosting profits by denying as many claims as possible. But even with its much tighter regulation, the transition to a Dutch or Swiss model would be far less disruptive for insurance companies and their employees than Medicare for All.
If You Like Your Plan . . .
The failure of the Affordable Care Act to deliver on President Obama’s incautious promise, “If you like your health care plan, you can keep it,” helped spark a widespread backlash against that program. No such promise should ever have been made. There are too many health care plans in today’s system that make no sense even to try to keep.
Employer-sponsored health insurance (ESHI) is Exhibit A in that regard. ESHI, which covers about half of all households, came into being in the 1940s as a wartime accident. It has been nothing but trouble ever since. It is a source of job lock that ties millions of Americans, terrified of losing coverage, to unsuitable careers. What is more, it contributes to fragmentation and raises administrative costs.
Above all, ESHI is appallingly inequitable. Economists Robert Kaestner and Darren Lubotsky estimate that workers in the bottom fifth of the family income distribution get annual tax benefits of less than $500 from ESHI, while those in the top fifth get benefits averaging $4,500. What is more, their data show that inequity to have become worse over time.
Still, surveys have repeatedly shown that more than two-thirds of people on ESHI like their plans. Presumably, many of those are people who have little chance of getting other coverage. Others have no interest in changing jobs, or are on the favored end of the unequal distribution of tax benefits. Whatever the reason, Medicare for All’s determination to throw millions who like what they have into an unfamiliar new system is a major barrier to its adoption.
UCC, in contrast, could be phased in more gradually than Medicare for All, especially for employer-provided plans. One possibility would be to lift the employer mandate, phase out the tax deductibility of ESHI, and allow employees to opt into UCC if they chose. Most lower-paid workers would probably take that option. Employers who wanted to use health care benefits to retain higher-paid employees could offer them supplemental policies. That way many fewer people would have to make a change of plans against their will.
Cost Controls
Any successful health care reform will have to deal with the high prices charged by American doctors, hospitals, and pharmaceutical companies. Medicare for All takes a risky and simplistic approach to cost control through across the board cuts in of as much as 40 percent in reimbursement rates for doctors and hospitals. That could be very disruptive to the many communities where hospitals are among the biggest employers.
UCC, too, would need to put downward pressure on excessive prices, but it could do so in a more nuanced way. Like Medicare for All, UCC would empower government administrators to bargain for favorable prices with hospitals, doctors, and drug companies. However, direct bargaining would be only one of several cost-control mechanisms. Market-based cost controls would back up administrative actions for consumers who have not reached their oout-of-pocket limits. Measures to promote competition and transparency, and to reward those providers who offer the best value for money, would make it easier than it is today for such consumers to shop wisely for health care services.
Transition Will Never be Easy
No matter what the final design, comprehensive health care reform will encounter problems of transition. Our existing system is not a product of rational design. It performs so far from optimally that there will be no way to fix it without big changes, necessarily disruptive. Providers and consumers who exploit imperfections in the system to their own advantage will resist change.
Transition will never be easy, but there is no reason to make it harder than it needs to be. The versions of Medicare for All now on the table in the House and Senate face obstacles that are likely to prove insurmountable. The greater pragmatism and flexibility of universal catastrophic coverage offers a less hazardous path forward.
Based on a version previously published at NiskanenCenter.com
Subscribe to:
Posts (Atom)