 As talk of a new recession grows louder, everyone is
watching some favorite indicator. The yield curve, claims for unemployment, the
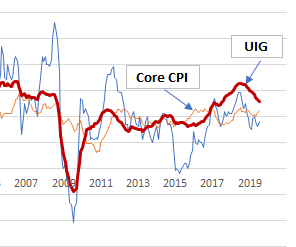
quits rate — you name it. What surprises me is how few people are watching an
underappreciated indicator from the New York Fed that uses more than just price
data to tell us what is happening with inflation.
As talk of a new recession grows louder, everyone is
watching some favorite indicator. The yield curve, claims for unemployment, the
quits rate — you name it. What surprises me is how few people are watching an
underappreciated indicator from the New York Fed that uses more than just price
data to tell us what is happening with inflation.
What makes the Underlying Inflation Gauge (UIG) unique is
its power to distinguish between changes in the cost of living and changes in
the rate of inflation. Did you think those were the same thing? Think again,
and read on.
What’s the difference?
The concept of the cost-of-living stems from the first of
those role of money as a medium of exchange. When we say the cost
of living increases, we mean that it gets harder to maintain a given standard
of living on a given income. Either we have to be satisfied with fewer goods or
services, or save less, or work harder. In the language of economics, a change
in the cost of living is a real phenomenon.
Inflation, in concept, is best understood a change in the
value of our unit of account, the dollar. When there is inflation,
the value of the unit is smaller each day than it was the day before, for all
transactions.
Imagine that you woke up one morning to find that someone
had chopped an inch off all our rulers, so that today’s foot was now only as
long as yesterday’s eleven inches. You might go from being six feet tall to
six-foot-six, but it wouldn’t be any easier for you to reach the top shelf in
the kitchen without a footstool. Similarly, if inflation raises both your
income and the prices of everything you buy by the same percentage, the value
of a dollar as an economic ruler shrinks, but it is neither harder nor easier
to maintain the same real standard of living. In that sense, inflation does not
measure anything real. It is a purely nominal phenomenon.


