The most challenging problem in health care policy is how to deal with the very tip of the cost curve — the 10 percent of the population who account for two-thirds of all personal health care spending; or among them, the 5 percent of the population who account for half of all spending; or among them, costliest of all, the 1 percent who account for a fifth of all spending.
The challenge is made harder still by the fact that insurance — in the traditional meaning of the term — is not an option. A large percentage of cases at the upper end of the curve fail to meet two standards of insurability.
One is that an insurable risk must be the result of unpredictable chance. In reality, though, many individuals suffer from chronic conditions like diabetes that make them certain to require costly care for the rest of their lives. Others have genetic markers that make them medical time bombs from the point of view of private insurers.
A second standard of insurability is that the actuarially fair premium — one high enough to cover the expected value of claims — must be affordable. However, an actuarially fair premium for many people with costly chronic conditions would exceed their entire income.
There are several partial solutions to the noninsurability of high-end health care risks. Guaranteed renewal requires insurers to continue to issue policies to those who become ill, provided there is no break in coverage. Guaranteed issue, which requires insurers to accept any applicants, regardless of pre-existing health conditions, is an even stronger step in the same direction. Community rating requires insurers to charge the same premium, based on average claims, to everyone in a general category regardless of their health status.
The Affordable Care Act uses a combination of these requirements to ensure that people can buy health insurance at a standard price regardless of pre-existing conditions. However, doing so creates problems of its own. For one thing, these requirements make the system vulnerable to adverse selection since healthy people can remain uninsured and buy into the system only when they become ill. Also, even with community rating, spreading health care costs evenly over an entire population can mean unaffordably high premiums for people with low incomes.
That brings us to the subject of this commentary — policies that aim to cut off the top end of the cost curve in order to make health care more affordable and accessible for everyone else. High-risk pools and reinsurance are two ways of doing this. After reviewing the way these approaches work, we will explain how their benefits can be realized through a policy of universal catastrophic coverage (UCC).
Friday, June 29, 2018
Thursday, June 28, 2018
How to Leave the Euro: A Practical Roadmap for Italy
The leaders of Italy’s new populist government say they do not want to leave the euro. Except, no one believes them.
They are on record as saying the euro was a bad idea. Until they were stopped by the President of the Italian Republic, they tried to appoint Paulo Savona, a well-known euroskeptic, as finance minister. Instead, they appointed him European Affairs Minister. In a recent book, Savona called the euro a “German cage” and wrote that “we need to prepare a plan B to get out of the euro if necessary ... the other alternative is to end up like Greece.” In short, it is not surprising that the new government’s commitment to the euro is in doubt.
When whenever the possibility that some country might leave the euro arises. Leaving abandoning one currency and introducing a new one just too difficult, they say. They point to the years of planning that went into launching the euro in the first place. They warn that a country facing currencies would face a host of problems, ranging from panicked runs on banks to the need to reprogram vending machines.
Ultimately, though, such technical difficulties are surmountable. If Italy decides to leave the euro, the key to success will be to learn from the experience of the many countries that have changed currencies in the past. Here is a practical roadmap, drawing on the imaginative, pragmatic, devices that other countries have used to ease the introduction of a new currency.
Saturday, June 9, 2018
Could We Afford Universal Catastrophic Health Care Coverage?
Universal catastrophic coverage (UCC) is a health care plan that aims to protect all Americans against financially ruinous medical expenses, while preserving the principle that those who can afford it should contribute toward the cost of their own care. It offers a potentially attractive compromise between the current system, which leaves millions of people uninsured or underinsured, and more expensive, “first dollar” proposals that would cover all health care costs for everyone.
Skeptics often ask whether such a plan is affordable. The short answer is “Yes,” but I would prefer to frame the question differently. Rather than asking how much any given health care plan would cost, it is more useful to ask, “What is the best plan we could design for what we are politically willing to spend?” If we set that amount somewhere close to what the government now spends on health care, universal catastrophic coverage looks rather good. This post explains why.
The parameters of universal catastrophic coverage
First, we need to review the basic parameters that define any UCC plan. The simplest version of UCC would have just two parameters, a low-income threshold and, for those above the threshold, a deductible that varies with household income.
Saturday, June 2, 2018
Inflation Increasingly Erodes Wage Gains Even as Unemployment Falls
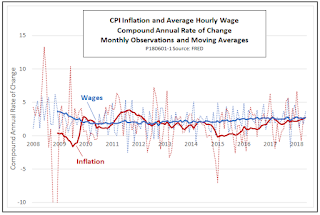
According to the latest Employment Situation Summary from the Bureau of Labor Statistics, average nominal hourly earnings for all employees on private nonfarm payrolls rose at a compound annual rate of 3.6 percent in May, 2016. That rate is well above the 2.6 percent average for the preceding 12 months, and also above the average CPI inflation rate of 2.5 percent for the same period. Monthly observations are shown by the dotted lines in the chart, while the solid lines show 12-month moving averages.
Monthly data include a lot of statistical noise and are subject to revisions, so policymakers will be paying more attention to trends than to individual data points. The trend lines show that over the past three years, CPI inflation has accelerated more rapidly than has the rate of nominal wage gains. CPI data for May will not be released until June 12, but by April, the last month for which full data are available, the 12-month moving average for wages exceeded that for inflation by just 0.1 percent (2.6 percent vs. 2.5 percent).
The trends of the moving averages contain both not-so-good news and better news. For workers, the news is not so good, inasmuch as the wage gains for May, which are hopeful taken in isolation, may turn out to be a statistical fluke. From a macroeconomic point of view, however, the news is better. With CPI and wage trends still holding at or close to 2.5 percent, there is little sign of overheating yet.
Reposted from Niskanen Notes
Friday, June 1, 2018
How Framing Affects Attitudes Toward the Social Safety Net
An article by Caitlin Dewey in the Washington Post led me to an interesting new piece of research by Rachel Wetts of U.C. Berkeley and Rob Willer of Stanford (unrestricted draft version here). The research, which is relevant for anyone in the area of public policy advocacy, shows how strongly framing—and the framing of charts, in particular—can affect attitudes toward pubic policies.
The specific issue that the authors investigate is the influence of information related to race on attitudes toward pubic assistance. As they put it in their abstract,
After viewing the information, participants were presented with scenarios designed to reveal attitudes toward welfare. In one scenario,
Although there were too few minority participants to produce a statistically significant results, their answers provide some food for thought. The nonwhites who had viewed Chart A said they would cut TANF by 53 percent, while those who had viewed Chart B said they would cut by 57 percent. About three-quarters of the recipients of cash assistance programs are nonwhite. Does TANF look better from a distance than from up close, or is this a statistical fluke?
And while we are on the subject of framing—would the results have been significantly different if the parenthetical word "Welfare," which is perceived pejoratively by many people, had not been inserted after "Temporary Assistance for Needy Families," which implies that the people who get it actually need it?
A previous version of this post appeared on Niskanen Notes
The specific issue that the authors investigate is the influence of information related to race on attitudes toward pubic assistance. As they put it in their abstract,
We argue that when whites perceive threats to their relative advantage in the racial status hierarchy, their resentment of minorities increases. This increased resentment in turn leads whites to withdraw support for welfare programs when they perceive these programs to primarily benefit minorities.In one of several experiments, Wetts and Willer presented a questionnaire to a sample of participants recruited from Amazon Mechanical Turk. Before answering questions about welfare policy, participants were shown one of two variants of a chart depicting U.S population trends by race and ethnicity. Both charts were based on the same data from the Census Bureau, but Chart A shows a short time period, over which the trends appear relatively weak, while Chart B shows a longer time period, over which the trends appear stronger. Chart B also adds a line for “all nonwhite” which more dramatically shows that the white population is trending toward minority status.
After viewing the information, participants were presented with scenarios designed to reveal attitudes toward welfare. In one scenario,
participants were told to imagine that they were on a Congressional committee charged with cutting $500 million from the federal budget. They were given a list of nine spending areas including “Temporary Assistance for Needy Families (Welfare)” and asked to indicate how much they would cut from each area.White participants said they would cut TANF by 28 percent if they had viewed Chart A and cut by 51 percent if they had viewed Chart B—a statistically significant difference.
Although there were too few minority participants to produce a statistically significant results, their answers provide some food for thought. The nonwhites who had viewed Chart A said they would cut TANF by 53 percent, while those who had viewed Chart B said they would cut by 57 percent. About three-quarters of the recipients of cash assistance programs are nonwhite. Does TANF look better from a distance than from up close, or is this a statistical fluke?
And while we are on the subject of framing—would the results have been significantly different if the parenthetical word "Welfare," which is perceived pejoratively by many people, had not been inserted after "Temporary Assistance for Needy Families," which implies that the people who get it actually need it?
A previous version of this post appeared on Niskanen Notes
Subscribe to:
Posts (Atom)